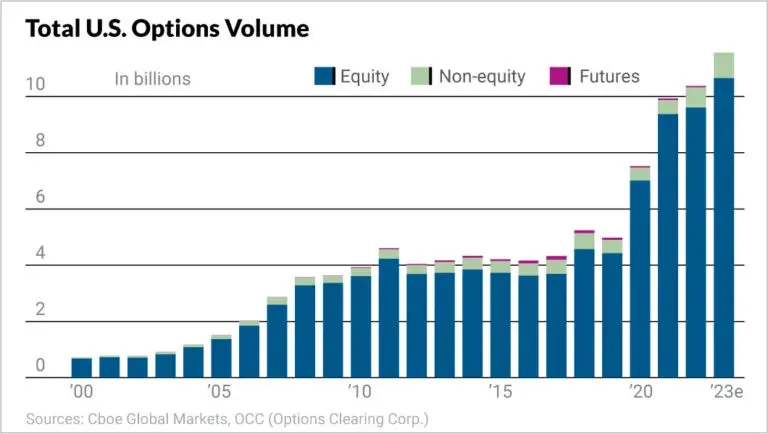
The options market has grown 5x in just the last three years.
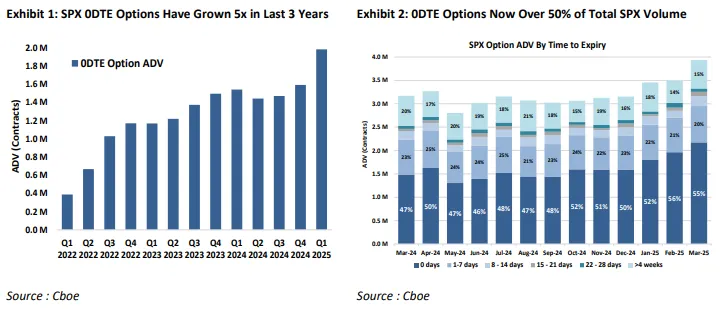
SPX zero-days-to-expiration (0DTE) options alone now make up over 50% of all SPX options trading, with over $1 trillion in notional value changing hands daily.
This explosive growth means options positioning often drives stock prices rather than the other way around – the tail is now wagging the dog. With that. understanding how all these participants are positioned has become critical for anyone trading today's markets.
What makes options markets particularly valuable is that they're inherently forward-looking. While price charts only show you what has already happened, options reveal where speculators expect prices to be in the future - across various time horizons.
This forward-looking aspect matters because markets are path-dependent. Today's positioning influences tomorrow's price movement, which then shapes the next day's action, so on and so forth.
By understanding how speculators are positioned not just now but across different future expirations, you can see the expected "roadmap" from point A to point B to point C.
That's precisely why we developed the Delta Balance tool.
This unique visualization shows you not just current positioning but future expectations in one clear view. It reveals whether call speculators (bulls) or put speculators (bears) are gaining momentum, exactly where that momentum is focused (above or below current price), and how sentiment is evolving across timeframes.
In this lesson, you'll discover how to use the Delta Balance tool to:
- See exactly where market expectations are focused across different time horizons
- Spot shifts in future positioning before they affect current price
- Identify whether the structural "path" supports a sustained trend or suggests resistance
- Use divergences between current and future positioning to anticipate market turns
Let's explore how this essential tool can help you navigate market structure with greater confidence.
And if you'd rather watch me read the lesson to you, no problem! Click on the video below:

What is the Delta Balance?
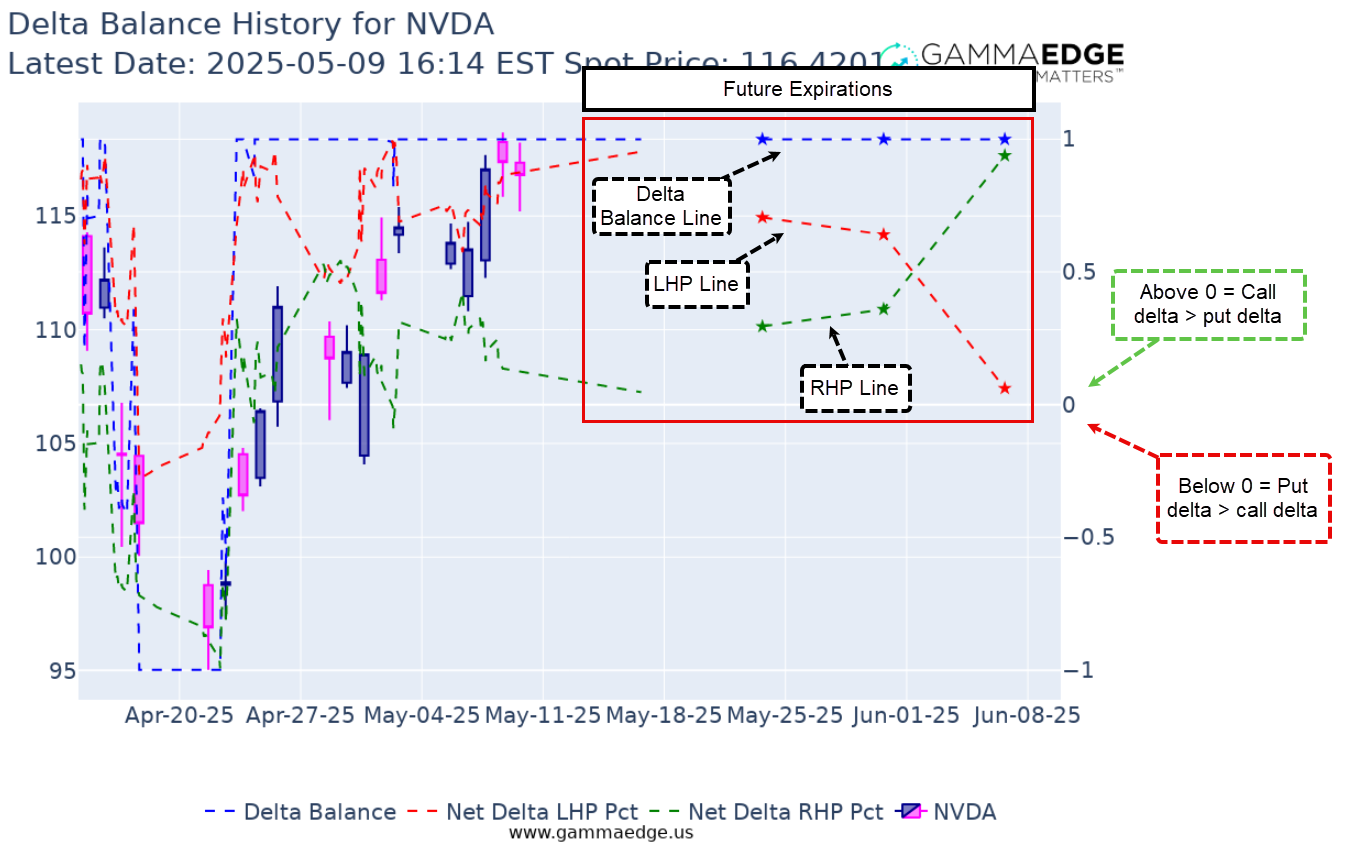
The Delta Balance tool visualizes the ongoing battle between call and put speculators above and below the current market price.
Think of it as a real-time map showing where bulls and bears are placing their bets. By tracking the balance of call and put delta, you can see exactly which side is dominating and where they're focusing their firepower.
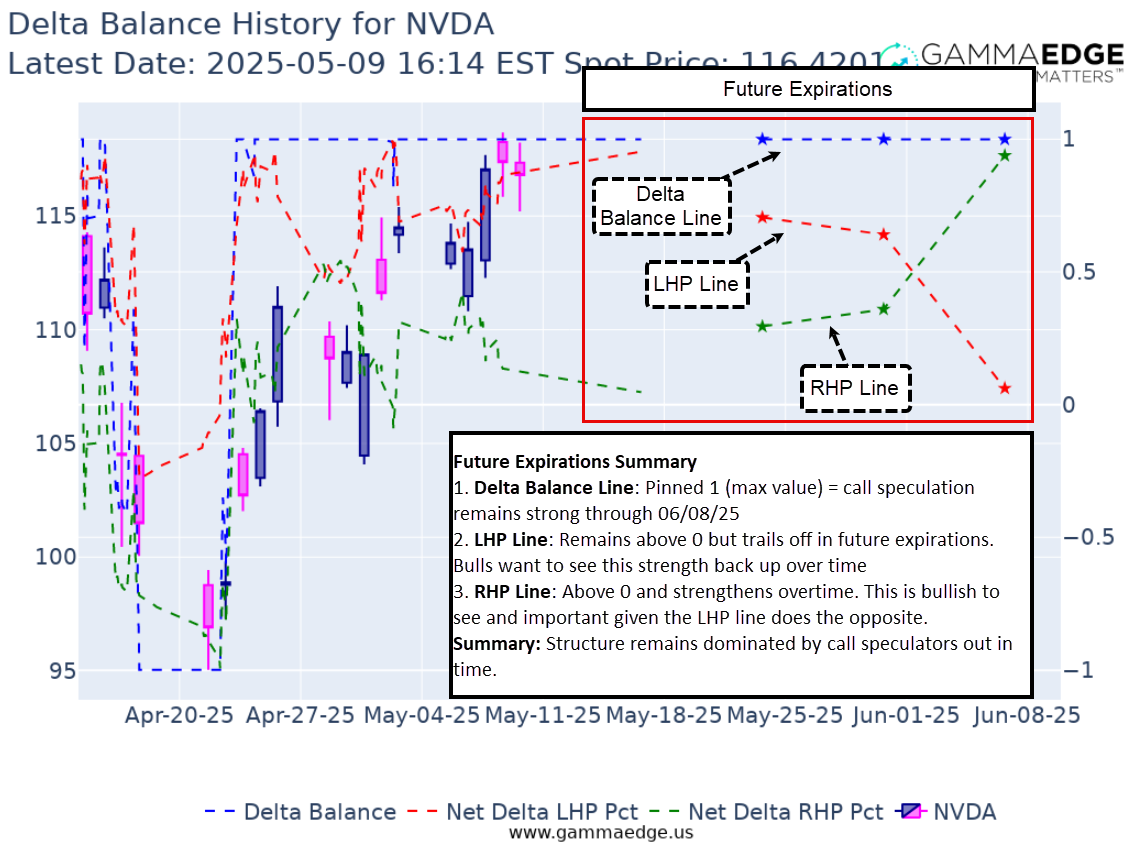
The visualization (an example provided below) produces three key trend lines:
- Green line: Shows who's winning above spot price (aka the right hand plane). As a reminder, an option can only take the form of an OTM Call or an ITM Put above spot price.
- Orange line: Shows who's winning below spot price (aka the left hand plane). As a reminder, an option can only take the form of an OTM Put or an ITM Call below spot price.
- Blue line: Shows the net balance across the entire structure (i.e., incorporates the positioning both above and below spot price).
Each line tells a simple story:
- Above 0: Calls are dominant (bulls have the advantage)
- Below 0: Puts are dominant (bears have the advantage)
Pro Tip: Just as with the GEX Ratio, the trend of the Delta Balance lines often tells a more important story than their absolute values. Watch how these lines evolve over time and into future expirations.
- Rising lines indicate strengthening call positioning (bullish momentum building)
- Falling lines show increasing put dominance (bearish pressure growing).
The red box on the right side of the visualization below shows future expirations - this is your window into the market’s future expectations. When future expirations show a different picture than current positioning, it can be an early warning of a sentiment shift before it appears in price.
Why It Matters to Your Trading
Traditional technical analysis focuses solely on price patterns, leaving you blind to the underlying forces driving those patterns. The Delta Balance tool solves this problem by revealing the actual positioning of market participants.
Think of it this way:
- Price charts show you what has already happened
- Delta Balance shows you what market participants are betting will happen next
This distinction is crucial because options positioning often shifts before price does, giving you early warning of potential market turns.
Here are three key benefits the Delta Balance provides:
- Structural insight: Reveals whether bullish or bearish positioning is dominant above and below current price
- Early warning system: Often shows sentiment shifts before they appear in price action
- Future expectations: The plotting of the delta balance for the future expirations visualized for us the future expectations of speculators in terms of price appreciation or depreciation
How to Read and Apply the Delta Balance
The real power of the Delta Balance tool comes from understanding what each component is telling you and how they work together to reveal market structure.
Step 1: Check Who's in Control
First, note where each line stands in relation to the 0 line:
- Right Hand Plane (Above Spot Price)
- Green line above 0: OTM calls dominate above spot price (bullish above)
- Green line below 0: ITM puts dominate above spot price (bearish above)
- Left Hand Plane (Below Spot Price)
- Orange line above 0: ITM calls dominate below spot price (bullish below)
- Orange line below 0: OTM puts dominate below spot price (bearish below)
- Delta Balance (Net of RHP and LHP)
- Blue line above 0: Overall call dominance in the structure (net bullish)
- Blue line below 0: Overall put dominance in the structure (net bearish)
Step 2: Identify the Structure Type
The combination of these readings creates four common structural patterns:
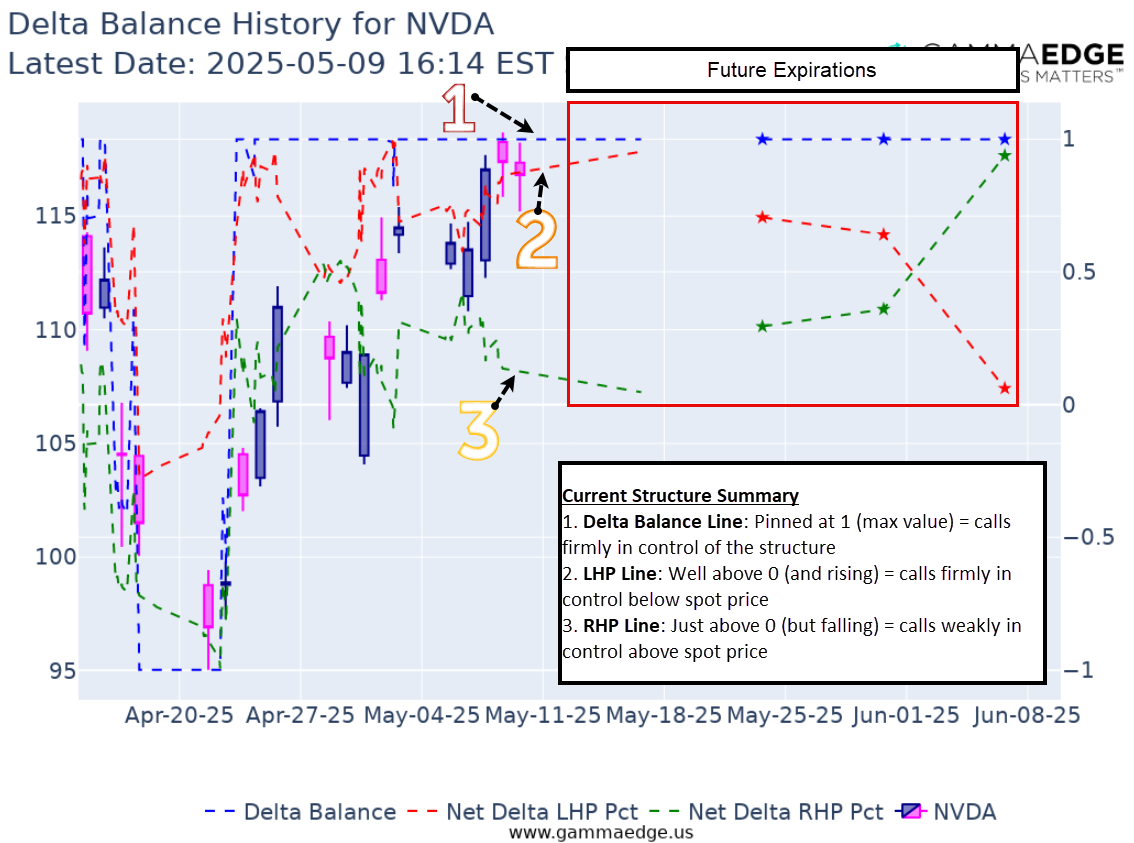
Bullish Structure:
- RHP (Green) line above 0 (calls dominant above spot)
- LHP (Orange) line above 0 (calls dominant below spot)
- Delta Balance (Blue) line pinned at or near 1 (maximum call dominance)
Bearish Structure:
- RHP (Green) line below 0 (puts dominant above spot)
- LHP (Orange) line below 0 (puts dominant below spot)
- Delta Balance (Blue) line pinned at or near -1 (maximum put dominance)
NOTE: A reminder to pay attention to the trend of the Delta Balance\LHP\RHP lines. Have they been trending higher, lower, or remained flat? Again the trend is just as important as the absolute number.
Step 3: Track Structural Evolution and Future Expectations
The true value of the Delta Balance tool comes from watching how structures evolve and change over time:
Strengthening Bullish Trend:
- RHP (Green) line rising or staying elevated
- LHP (Orange) line rising or staying elevated
- Delta Balance (Blue) line consistently at or near 1
- Future expirations showing similar or stronger call dominance
Deteriorating Bullish Trend:
- RHP (Green) line beginning to decline
- LHP (Orange) line beginning to decline
- Delta Balance (Blue) line moving away from 1
- Future expirations showing weakening call dominance or emerging put dominance
Strengthening Bearish Trend:
- RHP (Green) line falling or staying negative
- LHP (Orange) line falling or staying negative
- Delta Balance (Blue) line consistently at or near -1
- Future expirations showing similar or stronger put dominance
Deteriorating Bearish Trend:
- RHP (Green) line beginning to rise
- LHP (Orange) line beginning to rise
- Delta Balance (Blue) line moving away from -1
- Future expirations showing weakening put dominance or emerging call dominance
Pay special attention to the future expirations shown in the red box to the right of current positioning:
- Consistent structure across current and future expirations suggests strong conviction
- Divergence between current and future positioning often signals an upcoming trend change
- Future expirations typically lead current positioning, showing where sentiment is headed before price confirms
Use this analysis as confirmation for your trading bias:
- For bullish trades: Look for call dominance both above and below spot price
- For bearish trades: Look for put dominance both above and below spot price
- For caution signals: Watch for divergences between current positioning and future expirations
Remember: The future expirations often provide the earliest warning of sentiment shifts, allowing you to position yourself ahead of market turns rather than reacting to them after they've already begun.
FAQs and Common Objections
Q: "How is Delta Balance different from traditional sentiment indicators?"
A: Unlike traditional sentiment tools that simply measure overall put/call ratios, volume, or just things only through a price chart, Delta Balance specifically shows where sentiment is concentrated in the market structure. It reveals not just whether bulls or bears are dominant, but exactly where they're placing their bets relative to current price - both now and in future expirations.
Q: "Can this tool predict exact price targets?"
A: Delta Balance isn't designed to predict specific price targets. Rather, it shows you the structural forces that influence price movement. Think of it as revealing the path of least resistance rather than an exact destination. When used alongside other GammaEdge tools like the Market Trend Model, it helps you understand the "why" behind price movement.
Q: "What time frame works best with Delta Balance analysis?"
A: The Delta Balance tool is particularly valuable for multi-day and multi-week trades – its true power lies in showing structural shifts across different time horizons. Swing traders often find the most value by monitoring changes in future expirations for early signals of trend changes.
Q: "How often should I check the Delta Balance?"
A: For active traders, reviewing Delta Balance once in the morning is sufficient.
Q: "What if the green and orange lines show contradictory signals?"
A: Mixed signals (e.g., calls dominating above spot but puts dominating below) often indicate a transitional or consolidating market. These "mixed structure" scenarios typically lead to more choppy, range-bound price action until one side clearly takes control. During these periods, shorter-term trades or reduced position sizes may be appropriate.
Q: "How does Delta Balance work with other GammaEdge tools?"
A: Delta Balance works powerfully alongside other GammaEdge tools:
- Use with the GEX Ratio to confirm sentiment trends
- Combine with the Market Trend Model to align with broader momentum
- Use alongside the Web App Dashboard to understand key structural levels
The greatest unlocks often come from finding confluence between these different tools - when they all point in the same direction, your conviction in a trade increases significantly.
In fact, we wrote a specific deep dive on using the Delta Balance tool in tandem with the GEX Ratio, which you can unlock HERE.
Final Thoughts
The Delta Balance tool offers a unique window into market structure that price charts alone simply cannot provide. By revealing the positioning of call and put speculators across different timeframes, you gain insight into not just current sentiment, but where the market expects to go next.
What makes Delta Balance particularly powerful is its forward-looking nature. The visualization of future expirations often signals trend changes days or even weeks before they appear in price action - giving you a crucial edge in positioning ahead of major moves rather than chasing them after they've begun.
Through this lesson, you've unlocked how to:
- Interpret the three key trend lines (green, orange, and blue) that reveal who's winning the battle between bulls and bears
- Identify different structural patterns and what they tell you about potential price action
- Track how positioning evolves across time to spot strengthening or deteriorating trends
- Use future expirations to anticipate potential reversals or trend changes
Remember that the Delta Balance tool is most effective when used as part of your broader analysis. When combined with other GammaEdge tools like the GEX Ratio and Market Trend Model, you create a comprehensive view of market conditions that can significantly improve your trading decisions.
By incorporating Delta Balance into your daily routine, you'll start to see the market through the lens of actual positioning rather than just price movement - a perspective that can transform how you trade and help you stay consistently on the right side of the market.
Start by monitoring the Delta Balance for major indices and a few key stocks in your watchlist. Pay particular attention to any divergences between current positioning and future expirations, as these often provide the earliest signals of important market turns.
Until next time,
Taylor
GammaEdge Co-Founder