You've mastered support and resistance, moving averages, maybe even Fibonacci levels. But have you ever wondered why the price seems to stall or reverse at levels that don't show up anywhere on your charts?
While you're analyzing traditional technical indicators, there's a whole layer of profit targets hiding in plain sight - targets that come directly from where (and how) the collective options market is actually positioned.
And here's the thing…
If you've ever found yourself holding a winning trade with absolutely no idea where to take profits, you're not alone. You watch those green numbers climb, but without clear targets, you're essentially playing a guessing game with your gains.
Sound familiar?
Building on What You Already Know
In our previous article on transition zones, we covered how to identify where market control shifts between call and put speculators. We showed you how PTrans and NTrans act as natural entry signals when price breaks through these key levels.
If you haven't read that article, check it out first since today's lesson builds directly on those concepts. (Click HERE to access).
From Entry to Exit: Completing Your Trading Framework
Now that you understand WHERE to enter trades using transition zones, the next question is: WHERE do you exit? That's precisely what we're covering today.
We're going to introduce you to four key levels that act as natural profit targets in the options market:
- +GEX: Your primary upside target
- COI: Your secondary upside target
- -GEX: Your primary downside target
- POI: Your secondary downside target
These aren't arbitrary technical levels drawn on a chart - they're derived directly from where options speculators have placed their biggest bets.
By the end of this article, you'll have unlocked what each of the four levels means, how to incorporate them into your trading plan, and examples of their usefulness in action.
Are you ready to stop guessing where to take profits and start using levels that actually matter? Let's dive in.
Your Upside Profit Targets
Let's start with the bullish side of the equation. When you're holding a long position and price is moving in your favor, you need to know where profit-taking is most likely to occur.
Two key levels matter here, and understanding their differences is crucial for your exit strategy.
NOTE: The expectations at these levels are fundamentally different from PTrans/NTrans, which tend to accelerate price movement. At +GEX and -GEX, both discussed below, these are natural levels for monetization (i.e., profit taking), where we can see price pause or reverse. Because of this, these are great spots to use as upside or downside profit-taking targets for your trades, respectively.
Positive GEX (+GEX): Your Primary Target
What it is: The strike with the highest positive gamma in the entire options complex for the expiries being reviewed. As we look above this strike, we see a significant reduction in positive gamma (i.e., short-term speculation).
Why it matters: +GEX represents the strike (focal point) with the most short-term call speculation in the options market. Said another way, price gravitates towards areas with the most trading activity (liquidity), and this strike provides just that.
Remember, gamma is most prominent at-the-money and near expiration. Gamma is convexity; gamma is leverage. Therefore, when we see major gamma strikes, like +GEX, we know those are a culmination of short-term bets by market participants where they maximize their profits. If those levels are hit, they are likely to monetize their position (i.e., take profits).
The trading logic: Speculators took on out-of-the-money risk when buying these options. Let's say the stock was trading at $100, and +GEX sits at $120. Those call buyers risked $20 of potential loss if the stock went nowhere.
Once price reaches $120, those speculators have captured all of that out-of-the-money risk. Their options are now at-the-money, they're sitting on profits, and human nature kicks in - they want to lock in those gains.
How to use it in your trading: This level should be used as a profit target for long trades initiated off PTrans. Beyond +GEX, expect limited upward speculation as the “juice has been squeezed.” By this, we mean that +GEX is the most convex strike in the complex. The option's price increases at a nonlinear rate up to this level. Once through this level, the appreciation rate slows, with the option acting more like a stock and is subsequently less attractive to hold.
This level matters whether you're holding calls, shares, or futures because it represents where the largest options-based leverage is concentrated. Dealers will likely have to respond by pushing prices upward through their hedging and risk-management requirements.
Key insight: Just because participants take their profits at +GEX doesn’t mean the trade is over. In a sustained bullish environment where we see prices grind higher, +GEX often leads to higher prices in a level-to-level fashion. This suggests that once +GEX is hit and then (+GEX) shifts higher, those participants have rolled their positions higher, indicating higher price expectations in the short term.
Call Open Interest (COI): Your Secondary Target
What it is: The strike with the highest call open interest - essentially where the collective "wisdom of crowds" expects price to go.
How it's different: COI doesn't have the time component that +GEX does. We don't know if those calls expire tomorrow or next year. But what we do know is that this strike represents the largest concentration of bullish bets in the entire complex.
The magic of trending markets: In a proper bullish structure, COI is higher than +GEX, offering an excellent secondary profit target (the first being +GEX, as mentioned above). Once the original +GEX is reached, it should shift higher to align with COI under bullish conditions. This tells you that speculators aren't just taking profits - they're rolling their positions higher, indicating continued bullish expectations.
The point we are trying to drive home is that when trading to the long or short side, we want to have expectations for areas where it logically makes sense to lock in partial profits. With the information we have at any given point in time, we know that +GEX and ultimately COI represent these areas where there are large speculative bets, where, given those levels are reached, the participants who placed those bets are likely to lock in some profits of their own.
Example
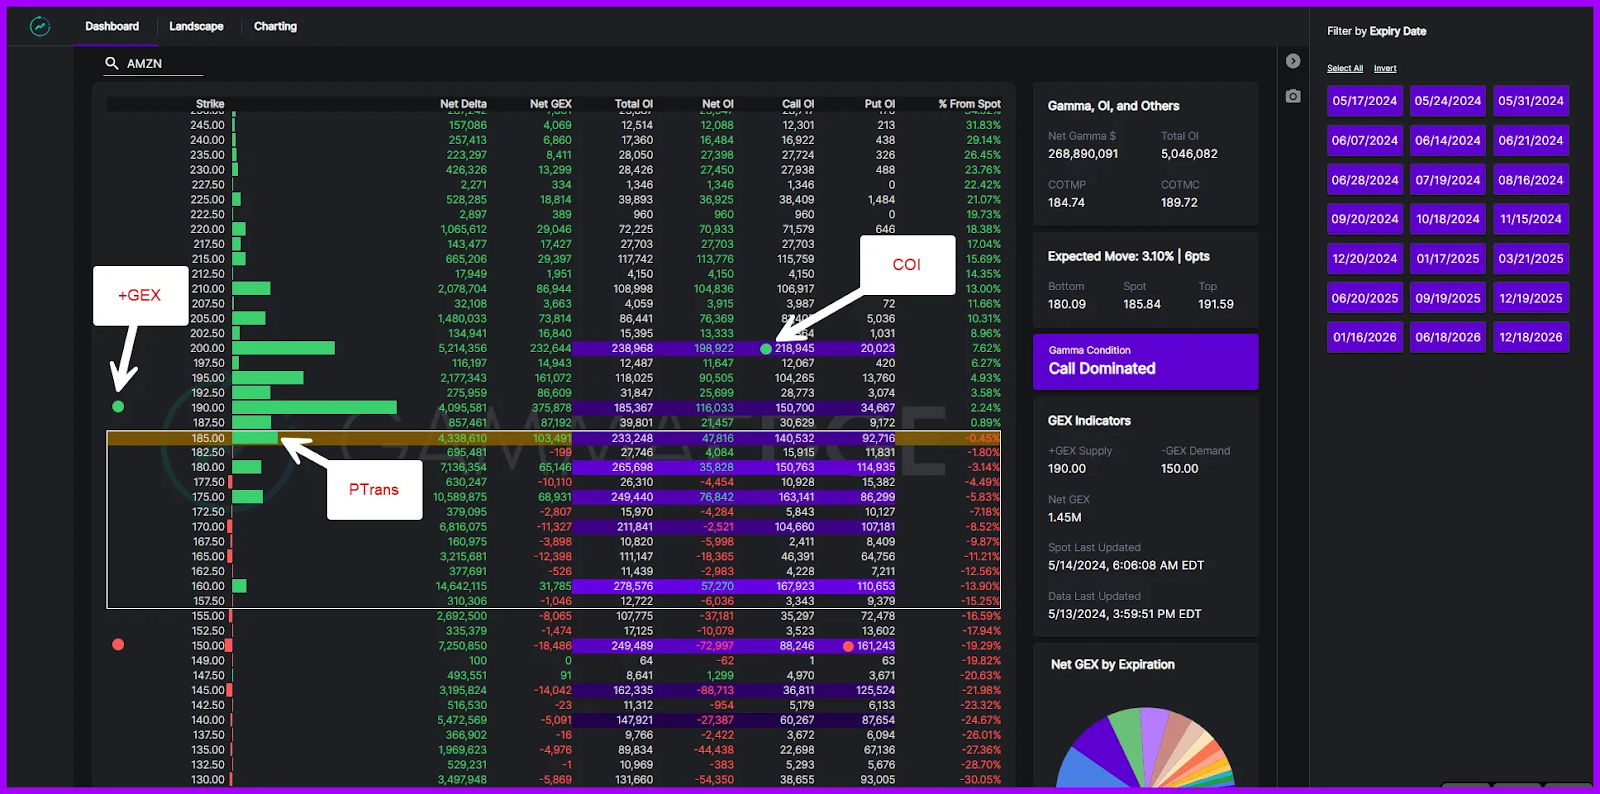
As shown in the visual below, the environment is clearly bullish, given that the spot price above and below is controlled by call speculators. Above PTrans at 185, the gamma profile starts to build out, evidence of higher short-term bets.
+GEX is at 190, one of the complex's largest call open interest positions. Ultimately, COI is sitting at 200, which, given the information we have right now, looks to be a great upside target. If/when 200 is hit, we want to see how the structure has changed and if we see a shift in speculative bets higher than 200. If so, this would give us confidence that we could see a continuation higher.
If we don’t, this indicates that the market doesn’t expect higher prices and may be exhausted in the short term. If they did expect higher prices, we’d see it in +GEX and COI shifting higher.
Your Downside Profit Targets
The downside levels work exactly the same way, just in reverse.
Negative GEX (-GEX): Your Primary Downside Target
What it is: The strike with the most negative gamma, representing the largest short-term put bets in the market.
How it works: Like with +GEX, speculators have captured their out-of-the-money risk when the price reaches this level and are likely to take profits.
Put Open Interest (POI): Your Secondary Downside Target
What it is: The strike with the highest put open interest, showing where the collective market expects price to go on the downside.
The trending dynamic: In a strong downtrend, you'll often see -GEX shift lower toward POI, indicating continued bearish speculation.
Example
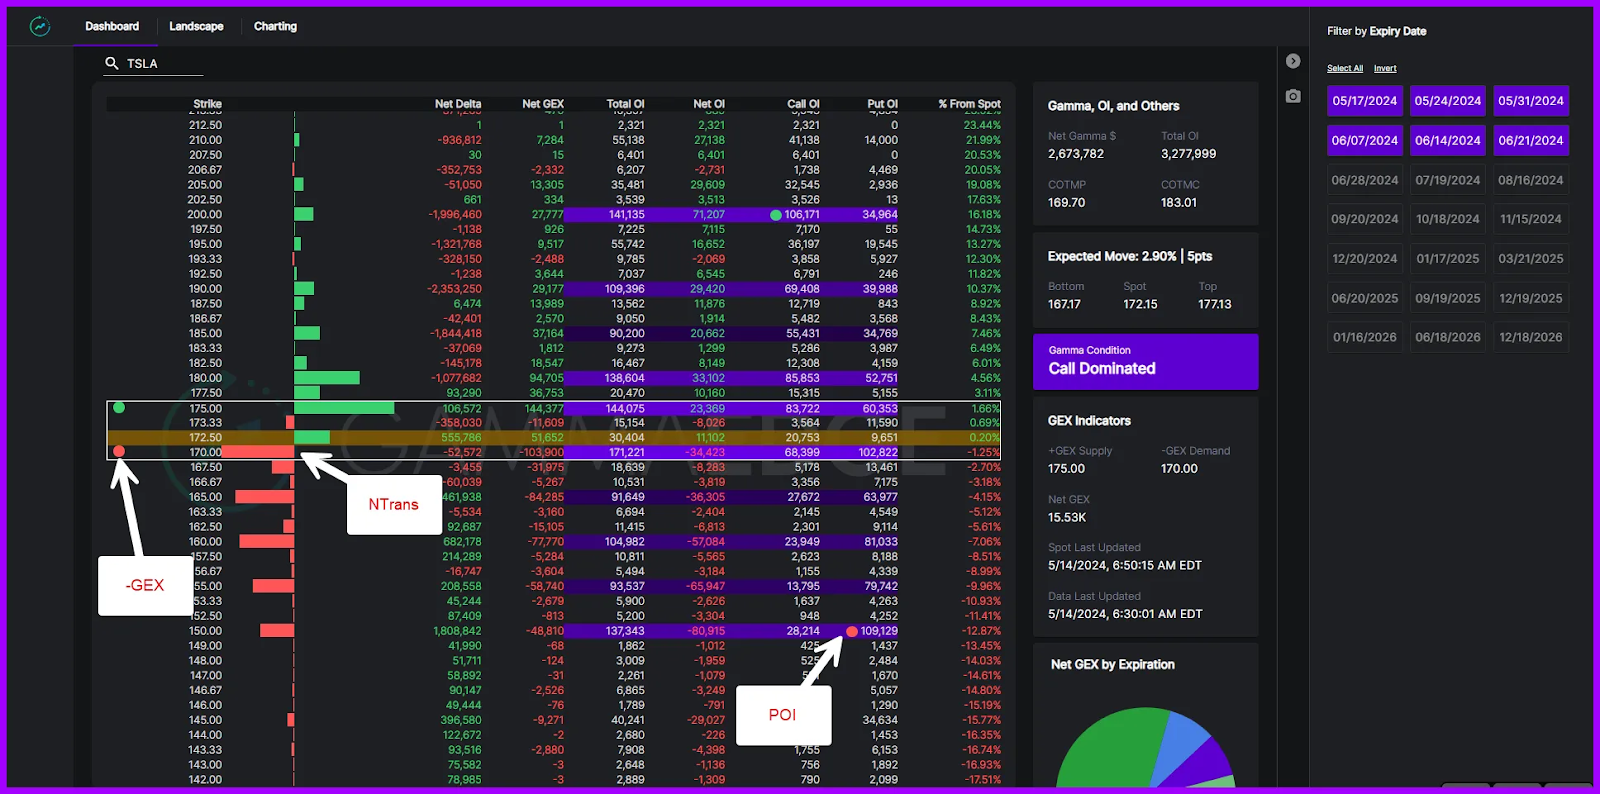
In the visual below, we can see:
- (i) above spot price is controlled by put speculators (look at the “net delta” column for this), and
- (ii) price is within the transition zone
If price breaks through the bottom of the Transition Zone (170, which is also -GEX), we would expect it to continue lower, ultimately to 150 (POI).
However, it’s especially critical during periods of market weakness that we see confluence with the Market Trend Model. Shorting the market can be tricky and requires a different skill set than going long, as moves to the downside can be quick and sharp, as opposed to the long side, which can be slow grinds higher.
The last point to make here is that if we do see price break below NTrans and progress lower, we want to see continued deterioration in the structure (OTM put speculators coming into the market, which is visible via the dashboard as strikes below spot shift from green to red in the “Net Delta” column).
NOTE: These levels are fractal, meaning they can be incorporated into all timeframes you analyze. These levels play a key role in our SPX 0DTE trading strategy, which you can review here: Click HERE.
Why These Levels Work
You might be thinking, "This sounds too simple. Why would these levels matter more than traditional technical analysis?"
The psychology factor: These levels represent real money at risk from real market participants. When thousands of traders have positioned themselves for a move to a specific strike price, that creates genuine supply and demand imbalances.
Real-time vs. historical: Traditional technical analysis relies on historical price patterns and subjective interpretation. These options-derived levels represent current, real-time positioning from the market itself. Remember, the options market is inherently forward-looking.
The poker analogy: If you knew exactly where the most prominent poker players at the table had placed their bets, wouldn't that influence your decision-making? That's what these levels give you.
Pro-Tips
Here's what separates trending markets from exhausted ones:
Strong trending markets: These levels don't just sit there static. They move in the direction of the trend, showing you that speculators are continuing to press their bets rather than taking profits.
Warning signs: When +GEX shifts higher as price approaches it, the market tells you, "We're not done yet." When it stops shifting, that's often the first warning sign that the move might be running out of steam.
Yeah, But...
"What if price doesn't respect these levels?"
No level works 100% of the time, and these options-derived targets are no exception. The key is understanding that these levels work best when used as part of a complete framework, not in isolation.
Look for confluence with your transition zone analysis and overall market trend. If price is above PTrans with a bullish structure and +GEX aligns with resistance from other technical factors, these levels become most reliable.
Remember, these are profit-taking zones, not rigid walls. Sometimes, the price will move right through them, especially in strongly trending environments, which is valuable information that tells you the move might have more legs than expected.
"How do I know which timeframe to use?"
The beauty of these levels is that they're fractal, meaning they work across multiple timeframes. The key is matching them to your trading style and goals.
- For day traders: Focus on shorter-term expirations where gamma is most concentrated. These levels will be more sensitive and shift more quickly.
- For swing traders: Look at weekly and monthly expirations where the larger positioning typically resides. These levels are more stable and provide better, longer-term targets.
Pro tip: Identify where the most gamma and open interest sit. The timeframes with the heaviest positioning are usually the most relevant for price movement.
Wrapping It All Up
These four levels - +GEX, COI, -GEX, and POI - give you what most traders are missing: objective, market-derived profit targets based on actual positioning rather than subjective chart patterns.
Here's why this matters: Instead of guessing where to take profits or relying on arbitrary percentage gains, you now have the same targets that informed options traders are watching. These levels eliminate the guesswork from one of trading's biggest challenges.
The key insight: These levels work because they represent where real money is positioned in the market. When thousands of traders have bet on a move to a specific strike, that creates genuine supply and demand dynamics that traditional technical analysis simply can't capture.
Your Next Steps
Ready to start incorporating these levels into your trading? Here's your action plan:
- Review the basics: Make sure you understand transition zones from our previous article
- Start observing: Begin tracking these four levels on your current watchlist
- Practice identification: Focus on +GEX and COI for bullish setups, -GEX and POI for bearish ones
- Watch the dynamics: Note how levels shift (or don't shift) during trending moves
- Integrate gradually: Start using these as profit targets alongside your existing strategy
The combination of transition zones for entries and these key levels for exits creates a complete trading system based on market structure rather than guesswork.
Until next time,
Taylor
GammaEdge Co-Founder
P.S. The examples in this article are from past market conditions for educational purposes. For current market analysis and access to these levels in real-time, you can use our Web App Dashboard for visual representation or the $EM command for quick identification. Both tools are part of the GammaEdge platform and update continuously as market conditions change.