Setting The Stage: The New Market Reality
Have you ever noticed how markets don't quite behave the way they used to?
Perhaps you identified what appeared at the time to have been a perfect technical setup—only to then watch price move decisively through your carefully identified support level.
Or perhaps you've experienced the frustration of entering what looked to have been a strong trend, only to have found yourself immediately caught in unexpected sideways consolidation.
If this is you, you're not alone in this experience, and you're definitely not imagining things. The market truly has transformed and what's happening behind the scenes is a fundamental shift in what drives price action.
Today's markets aren't just responding to traditional supply and demand—they're increasingly influenced by massive options positioning that remains invisible to traders focused solely on price charts.

The Rise of Options
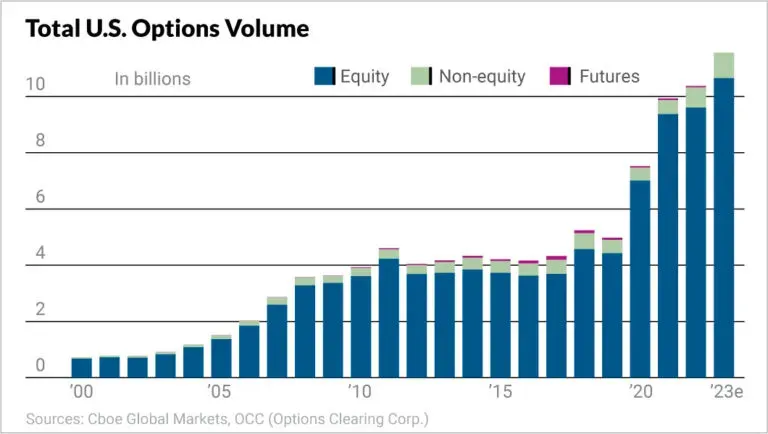
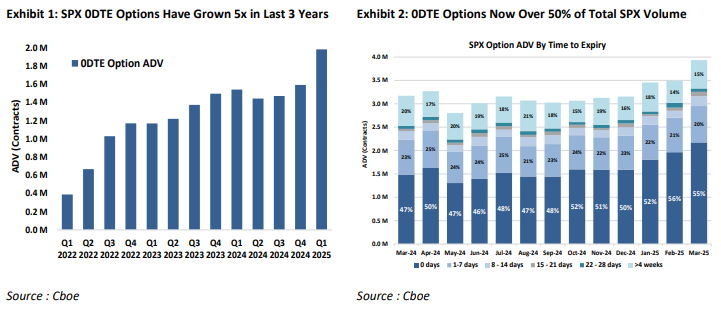
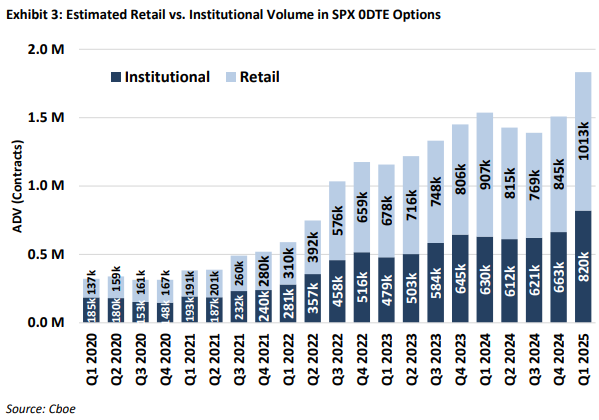
Over the last decade, the U.S. options market has experienced explosive growth, with trading volumes significantly outpacing the growth seen in futures trading. This surge is setting new records annually, fueled by an increase in retail participation and the popularity of short-dated options contracts (especially 0DTE - zero days to expiration).
Why The Change? One Fundamental Shift
What's crucial to understand is this shift has fundamentally altered how markets move. Traditionally, options were viewed as derivatives (aka tools to hedge) that followed stock prices. But today, we're witnessing the reverse: options are being used more and more as the primary vehicle for speculation and this exact speculative activity is increasingly driving the movement of the underlying stocks.
This shift is crucial because it reverses the traditional dynamic—now, the options themselves often drive the prices of the underlying assets, a phenomenon often described as "the tail wagging the dog.”
This isn't just theory either. We see it every day in stocks like TSLA, NVDA, and AAPL, where options volume can exceed the actual stock volume in notional value. When this happens, the options market becomes the primary driver of price, not the other way around.
And if you're not accounting for this in your trading strategy, you're missing half the picture.
Impact on the Markets
This transformation in market behavior influences the markets in two critical ways:
-
Speculator Dynamics: The ongoing battle between call buyers (who speculate on price increases) and put buyers (who bet on price decreases) throughout the options chain can significantly impact market structure (aka price action). Knowing these dynamics can provide valuable clues and help to inform potential future price paths of the underlying asset — said another way:
- What strikes are the masses (i.e., speculators) betting on price to move towards?
-
Is that conviction increasing or decreasing as time passes?
- These concepts can be applied to the intraday time frame (e.g., SPX 0DTE trading) as well as single stock swing trade (e.g., taking into account all expirations that an underlying offers).
NOTE: If you are lost on what calls and puts options are, not to worry! Go ahead and quickly search for these terms in Google, ChatGPT, or YouTube. Once you are up to speed, carry on this with this lesson.
- Market Maker Influence: The expanded role of the options market increases the influence of Market Makers/Dealers (MM/D). These entities manage the flow of options trades and, in doing so, can exert significant buying and selling pressures on the market. This occurs as they adjust their positions in response to the activities of call and put speculators mentioned above.
NOTE: There will be a newsletter edition in the coming weeks specifically dedicated to the role of Market Makers in today’s markets.
It’s easy to get overwhelmed with data these days, but we’ve developed tools to analyze these market dynamics SIMPLY.
We help you understand the tug-of-war between call and put speculators and identify crucial market levels where MM/D actions become inevitable. These key unlocks form the core pillars of the GammaEdge approach, which to reiterate are (i) market speculation (i.e., are participants more bullish or bearish?) and (ii) market structure (i.e., key trading levels).
Without tools to see and understand these dynamics, you're essentially trading blind to forces that increasingly drive today's markets.
Three Critical Problems Traders Face Today
As options increasingly influence price movements, three specific challenges have emerged for today's traders:
Problem #1: Incomplete Market Picture
Traditional technical analysis tools—moving averages, support/resistance, chart patterns—were designed for markets where price was the primary indicator of future movement. They weren't built to account for the massive influence of options positioning.
This creates a significant blind spot.
You might nail your technical analysis, but if you can't see what's happening "under the hood" of the market and how options are influencing the structure (and price action), you're missing critical forces that will impact price.
For example, have you ever found what looked like a perfect setup—clean consolidation, increasing volume, textbook chart pattern—only to watch the stock immediately reverse after hitting a specific price level or chop sideways for weeks?
This happens frequently when large concentrations of call options at specific strike prices create natural selling pressure as traders monetize their profitable positions. Or when call speculators suddenly exit the market while put speculators simultaneously step in—dynamics completely invisible on a traditional price chart.
Without seeing these forces, you end up with poor entries, premature exits, and missed opportunities that could have been avoided with better information.
NOTE: We aren't trying to say that everything is always because of the options market. GammaEdge isn't a hammer seeing everything as a nail. However, we are making the case that options frequently play a key role in driving price movement that conventional analysis simply can't explain.
Problem #2: Options Data Overwhelm
If you've ever opened a full options chain, you know how overwhelming it can be. Hundreds of strikes, multiple expirations, Greeks that change by the second—it's information overload.
Standard options analysis tools often add to the confusion by bombarding you with more data without clear guidance on what actually matters for your trading decisions.
At GammaEdge, we've developed visual tools that instantly simplify complex options data, while still providing detailed tables for those who prefer granular analysis. Instead of drowning in spreadsheets of Greeks and strikes, you'll see clear, color-coded visualizations that immediately show you where call speculators are dominant, where puts control the market, and precisely which price levels matter most for your trading decisions.
Problem #3: Lack of Systematic Approach
Even traders who recognize the importance of options data often struggle to integrate it into a cohesive trading strategy.
Common questions include:
- "I see unusual options activity, but how do I know if it's actually significant?"
- "How do I determine which price levels matter most for my entries and exits?"
- "How can I tell if the market is genuinely trending or just chopping around?"
Without a systematic framework, traders are left guessing about the current market environment and making decisions based on incomplete information.
At GammaEdge, our three-pillar framework of Trend, Structure, and Sentiment provides a complete system for trading in today's options-influenced markets. Rather than random indicators or subjective analysis, you'll unlock a repeatable process for determining:
- Whether the market truly has momentum in a particular direction (Trend)
- Where the key levels are for entries, exits, and targets (Structure)
- Who's winning the battle between call and put speculators and if their advantage is growing or shrinking (Sentiment)
This isn't theory—it's a battle-tested approach that works across timeframes, from intraday SPX 0DTE trading to multi-week swing positions.
The GammaEdge Solution: Three Pillars + Practical Tools
After years of observing how options influence price movement, we've developed a three-pillar framework that simplifies these complex dynamics into actionable unlocks for your trading system.
Pillar 1: Structure
What it is: Market structure refers to key price levels where market behavior changes due to options positioning. And to be clear, these aren't random technical levels.
They’re derived directly from the options market itself and represent points where dealer hedging behavior fundamentally shifts.
Why it matters: Understanding structure gives you precise levels for entries, exits, and profit targets that are invisible to traders using conventional analysis.
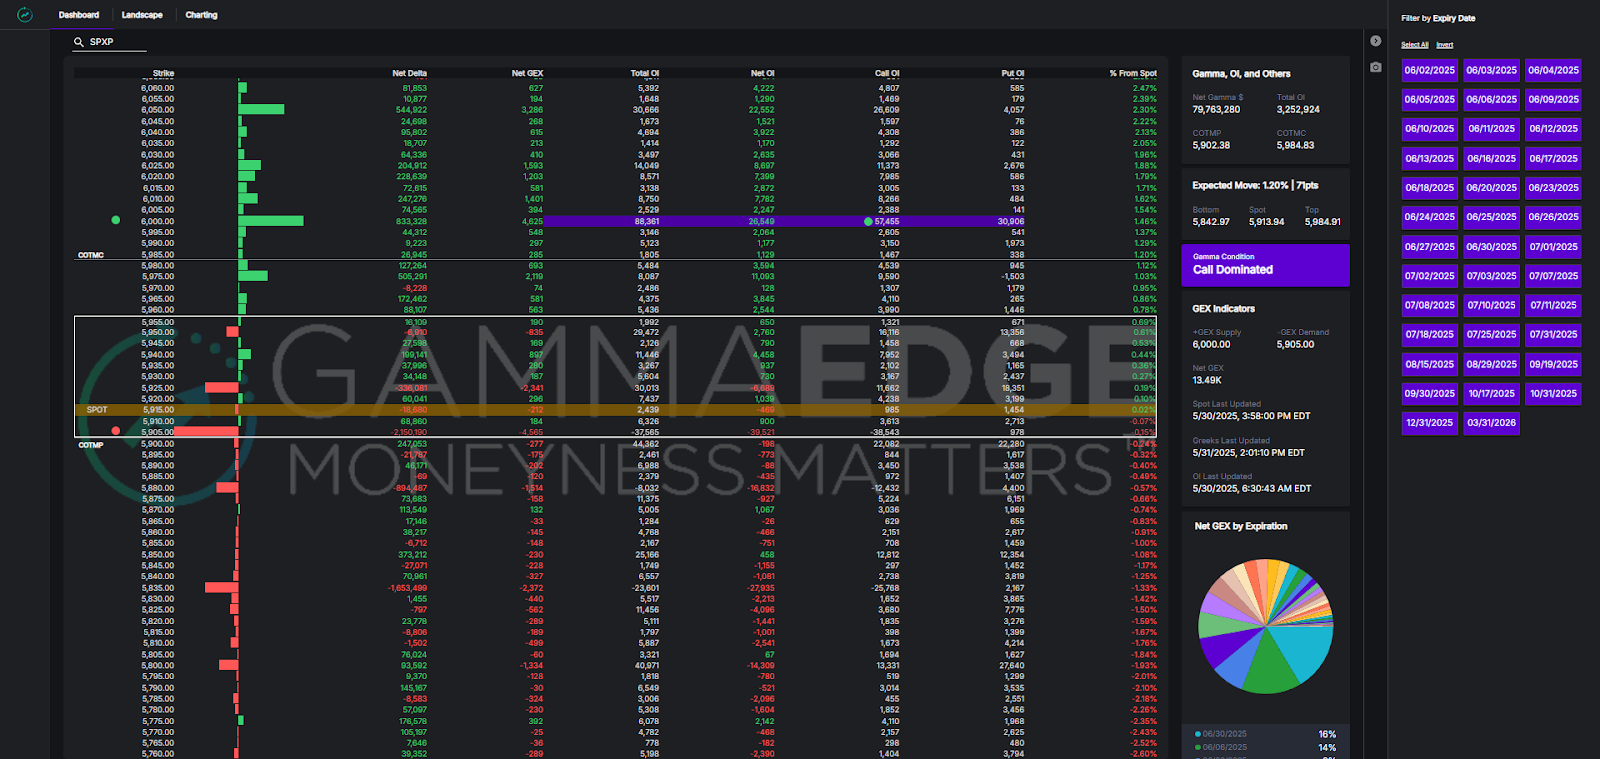
Key tool: Integrated Web App Dashboard
Our dashboard visually represents the options structure, clearly highlighting:
- PTrans/NTrans (key trading levels): The transition zone in the options structure where price tends to chop
- +GEX & -GEX (key trading levels): Large speculative positions in the options structure that routinely act as natural profit-taking
- COI/POI (key trading levels): Additional large speculative levels that act as key reference points in the options structure (and price targets)
Trading application: Instead of guessing where to enter or exit, you'll know exactly which levels matter most and why. For example, when trading AAPL with a bullish bias, our dashboard might show PTrans at $175. Once price breaks above that level, we typically see acceleration as dealer hedging creates buying pressure, with +GEX at $180 and COI at $185 providing clear profit targets. This gives you precise entry at $175.50 with targets at $180 and $185, and a stop below $174—a trading plan based on actual market structure rather than arbitrary chart patterns.
NOTE: Refer to the end of this article for links to deep dives on the tools referenced above.
Pillar 2: Sentiment
What it is: Sentiment analysis measures the ongoing battle between call and put speculators in the options market. It reveals who's winning that battle and whether their advantage is growing or shrinking.
Why it matters: By understanding sentiment, you gain key understanding into directional bias and conviction that isn't visible through price action alone.
Key tools:
- GEX Ratio: This proprietary metric measures the balance of call gamma to put gamma across expirations. Unlike the traditional put/call ratio, it incorporates the critical element of time and tells us if call or put speculators’ control is getting stronger or weaker.
- Delta Balance: This visualization shows who's controlling the market above and below current price not only in the current expiration, but within the future expirations as well. This is one of many key benefits of observing the options markets — they are forward looking by nature which helps us understand what speculators are EXPECTING to happen.
Trading application: These tools help you understand whether bulls or bears are gaining strength—often before that strength becomes apparent in price. For example, a declining GEX Ratio often precedes significant price weakness, giving you early warning of potential reversals. Same thought process with Delta Balance — the current expiration may be showing you calls are in control but if future near-term expirations are showing put speculators starting to gain strength, then this may suggest that the market structure is weakening.
NOTE: Refer to the end of this article for links to deep dives on the tools referenced above.
Pillar 3: Trend
What it is: Trend analysis confirms direction through actual buying and selling pressure in the market, not just technical indicators.
Why it matters: This ensures you're trading with the market's real momentum rather than fighting against the tide.
Key tools: Market Trend Model and Intraday Volume Analysis
Our Market Trend Model shows three distinct timeframes:
- The "here and now" trend via Cumulative Tick
- The short-term trend via Railroad Tracks
- The longer-term trend via the colored moving average ribbon
- We also have a way of understanding if the intraday price action is supported by significant/large buying or selling, which tells us if there is conviction behind the movement of spot price.
Our Intraday Volume Analysis specifically looks at SPX 0DTE and the activity of call and put speculators. This gives us knowledge identifying chop vs. trend days and the likely path of price throughout an intraday trading session.
Trading application: By aligning your trades with the prevailing market flow, you significantly increase your probability of success. The Market Trend Model and Intraday Volume Analysis helps you distinguish between choppy environments where protection of capital is paramount versus trending environments where you want to press your advantage.
NOTE: Refer to the end of this article for links to deep dives on the tools referenced above.
Who This Approach Works For
The beauty of our framework is its adaptability across different trading styles:
Swing Traders
If you're holding positions for days or weeks, our tools help you:
- Identify the strongest stocks with the most constructive option structures
- Spot early warning signs of sentiment shifts before they impact price
- Find precise entry points with favorable risk/reward profiles
Example: Our PTrans2PGEX strategy has delivered consistent results for swing traders by identifying stocks breaking through key structural levels with strong upside potential.
SPX 0DTE Traders
For intraday SPX traders, our approach provides:
- Real-time sentiment analysis to determine market character
- Precise structural levels for entries, exits, and targets
- Volume analysis that reveals where options flow is concentrating
Example: Our intraday volume analysis can help distinguish between "trending days" where price moves directionally versus "chop days" where price oscillates within a range.
The methodology scales across time frames from intraday to multi-week positions, giving you flexibility based on your trading style and objectives.
Note: Everything we teach for SPX 0DTE trading can be directly applied to futures trading as well. We focus our analysis on SPX options because they represent the most liquid and deep options market available, but you can easily execute your trades through ES, NQ, or other futures contracts based on the same structural knowledge.
Key Takeaways
Let's recap what we've covered in this article::
- Modern markets are increasingly driven by options positioning, creating a "tail wagging the dog" dynamic
- Traditional analysis alone creates a significant disadvantage for traders who can't see these "under the hood" forces
- The three critical problems traders face are: incomplete market picture, options data overwhelm, and lack of a systematic approach
- GammaEdge's three-pillar framework (Structure, Sentiment, Trend) simplifies complex options data into actionable tools
- Our toolkit provides specific solutions to help traders make better decisions across multiple trading styles and timeframes
Final Thoughts
Remember, trading with the GammaEdge advantage isn't about adding more complexity—it's about simplifying the market into actionable information that gives you an edge in today's options-driven environment.
Get ready to see the market with new clarity as we reveal the hidden forces driving today's price action.
Happy Trading,
Taylor
GammaEdge Co-Founder
P.S. This article was an overview on the GammaEdge process. For a deep dive into the tools mentioned through this article refer to those supplemented articles linked to below:
Structure
- Identifying and using our key levels: Coming soon…
Sentiment
- GEX Ratio: Click HERE
- Delta Balance: Coming soon…
Trend
- Market Trend Model: Click HERE
- Intraday Volume Analysis: Click HERE
Frameworks
- Market Turning Framework: Click HERE
- SPX 0DTE/Futures Trading with GammaEdge: Click HERE
- Swing Trading with GammaEdge: Coming soon…
- Staying In-Sync with the Markets: Coming soon…