You see a clean breakout above resistance, confidently enter the trade, and immediately get chopped to pieces as price bounces around like a pinball.
Sound familiar? Here's what's happening:
You're still trading like 2015, using traditional technical analysis while the market fundamentally changes. Today's markets are increasingly driven by options structure, not those support and resistance lines you learned about years ago.
The Reality Check-
You're drawing trend lines and watching moving averages, but...
- Options positioning is driving price action
- The big money isn't looking at your chart patterns
- They're positioned where market makers need to hedge
The gap between what moves markets and what most traders analyze has never been wider.
But here's the opportunity-
While others chase breakouts blindly, you can learn to read the structural forces that actually drive price action.
Through analyzing options structure, we've identified three critical transition zones that reveal exactly where to expect:
- Chop (avoid these areas)
- Acceleration (high-probability entries)
- Reversal (profit-taking zones)
Master these three zones and you'll:
- Trade with structural forces instead of against them
- Know which breakouts have structural support, and
- Identify traps before they happen
By the end of this article, you'll understand all three zones and unlock exactly how to identify them for tomorrow's trading session.
And here's a video walkthrough of today's content if you'd prefer watching rather than reading:

Why This Matters: The Structural Edge
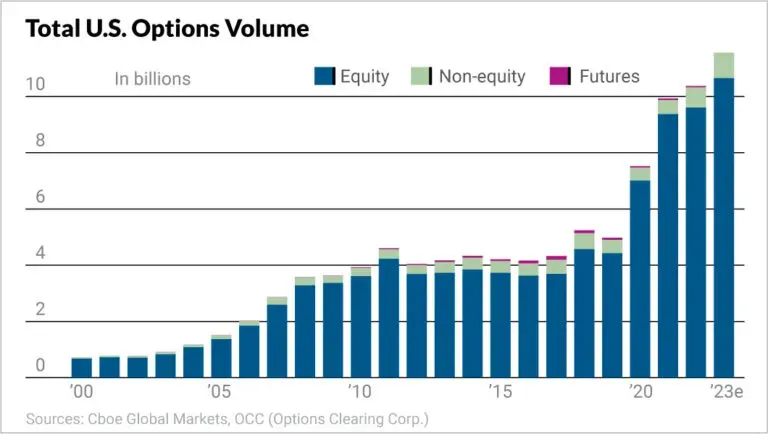
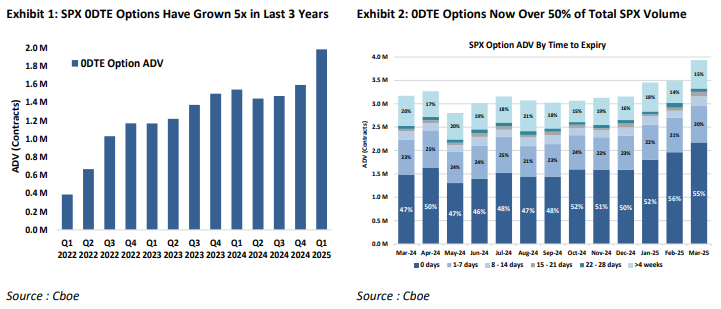
The numbers tell the story: Over the last decade, the U.S. options market has experienced explosive growth, with trading volumes significantly outpacing the growth seen in futures trading. This surge is setting new records annually, fueled by increased retail participation and the popularity of short-dated options contracts (especially 0DTE - zero days to expiration).
What does this mean for your trading? Everything.
The Market Shift
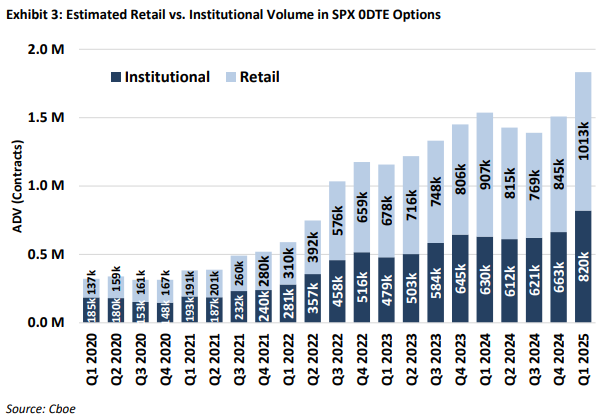
Both retail and institutional traders contribute to explosive growth in the options market. This collective activity is driving today's market structure and directly impacting price action in ways we've never seen before.
When options volume dominates, price action increasingly follows options positioning rather than traditional technical patterns. Those clean support and resistance levels that used to hold? They're meaningless if there's massive gamma exposure sitting right above them.
Your Opportunity
This shift creates a massive advantage for traders who understand it:
While others are:
- Drawing trend lines
- Watching for "technical breakouts"
- Using outdated analysis methods (or lagging indicators)
You'll know:
- Which moves have structural support
- Where market maker hedging flows will push price
- How gamma creates acceleration points
The Performance Gap
Random entries based on chart patterns work 40-50% of the time if you're lucky.
But understanding where market makers must hedge, where gamma creates acceleration, and where delta exposure builds pressure? That's how you stack the odds in your favor.
Your edge comes from reading the same playbook that options positioning is writing.
When you understand where the prominent positioning sits, you can anticipate how market makers will need to hedge and where that hedging will push price.
This isn't about predicting the future. It's about understanding the mechanical forces that drive short-term price action. And those forces are increasingly options-driven.
Ready to dive in? Let's start with the first zone that controls how explosive your moves will be.
Zone #1: GEX Transition Zone (Your Acceleration Detector)
Think of the GEX Transition Zone as your early warning system for explosive price moves. This zone shows where price will likely accelerate once it breaks free from choppy, sideways action.
What It Does
The GEX transition zone is essentially a "neutral zone" where options positioning minimally influences price direction. Inside this zone, neither calls nor puts have enough control to push price decisively in either direction.
Two key levels define it:
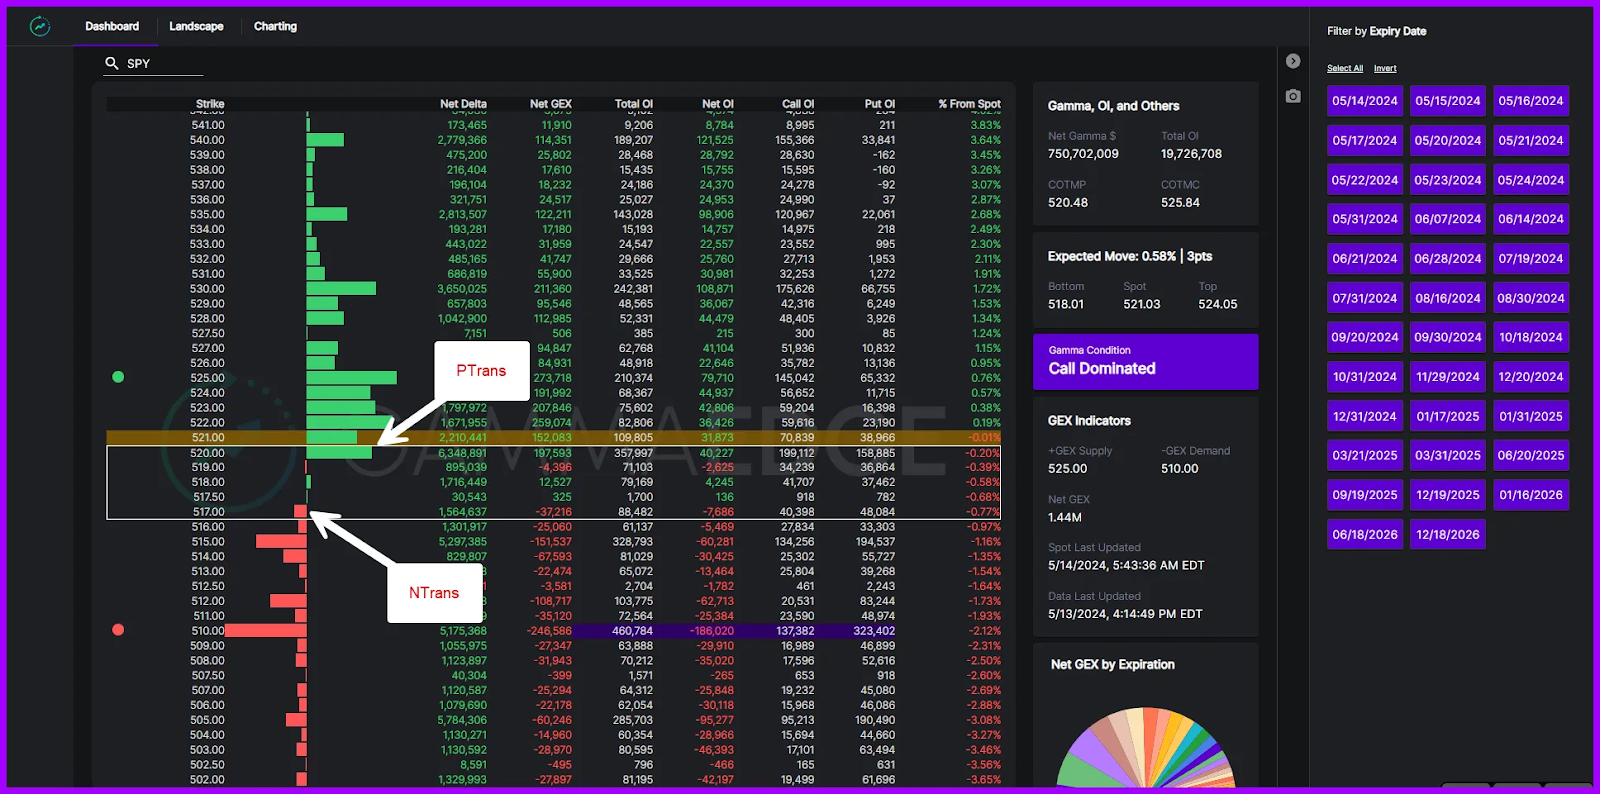
- PTrans (Positive Transition): The strike where it and all strikes above are call-dominated in terms of gamma. Think of this as your upside acceleration trigger.
- NTrans (Negative Transition): The strike where it and all strikes below are put-dominated in terms of gamma. This is your downside acceleration trigger.
When price trades between these levels, you'll see choppy, back-and-forth action as control shifts between calls and puts. But once price breaks outside? That's where the acceleration happens.
How It Works
Here's the key unlock: Market makers face minimal directional risk when price stays within the GEX transition zone. It's a low-pressure environment for them.
But the moment price breaks above PTrans, market makers face rapidly growing delta exposure due to gamma effects. This forces them to hedge aggressively by buying, which accelerates the move higher.
The exact mechanics work in reverse below NTrans - aggressive hedging accelerates moves lower.
Your Trading Edge
These levels become reference points for your trading decisions. Once price moves through PTrans or NTrans, expect acceleration in that direction. This is where you want to stack the odds in your favor.
Conversely, if price fails to hold the breakout and moves back into the transition zone, it signals choppy conditions and invalidates your directional thesis.
Critical Point: PTrans and NTrans are NOT traditional support and resistance levels. We expect price to accelerate through them, not bounce off them.
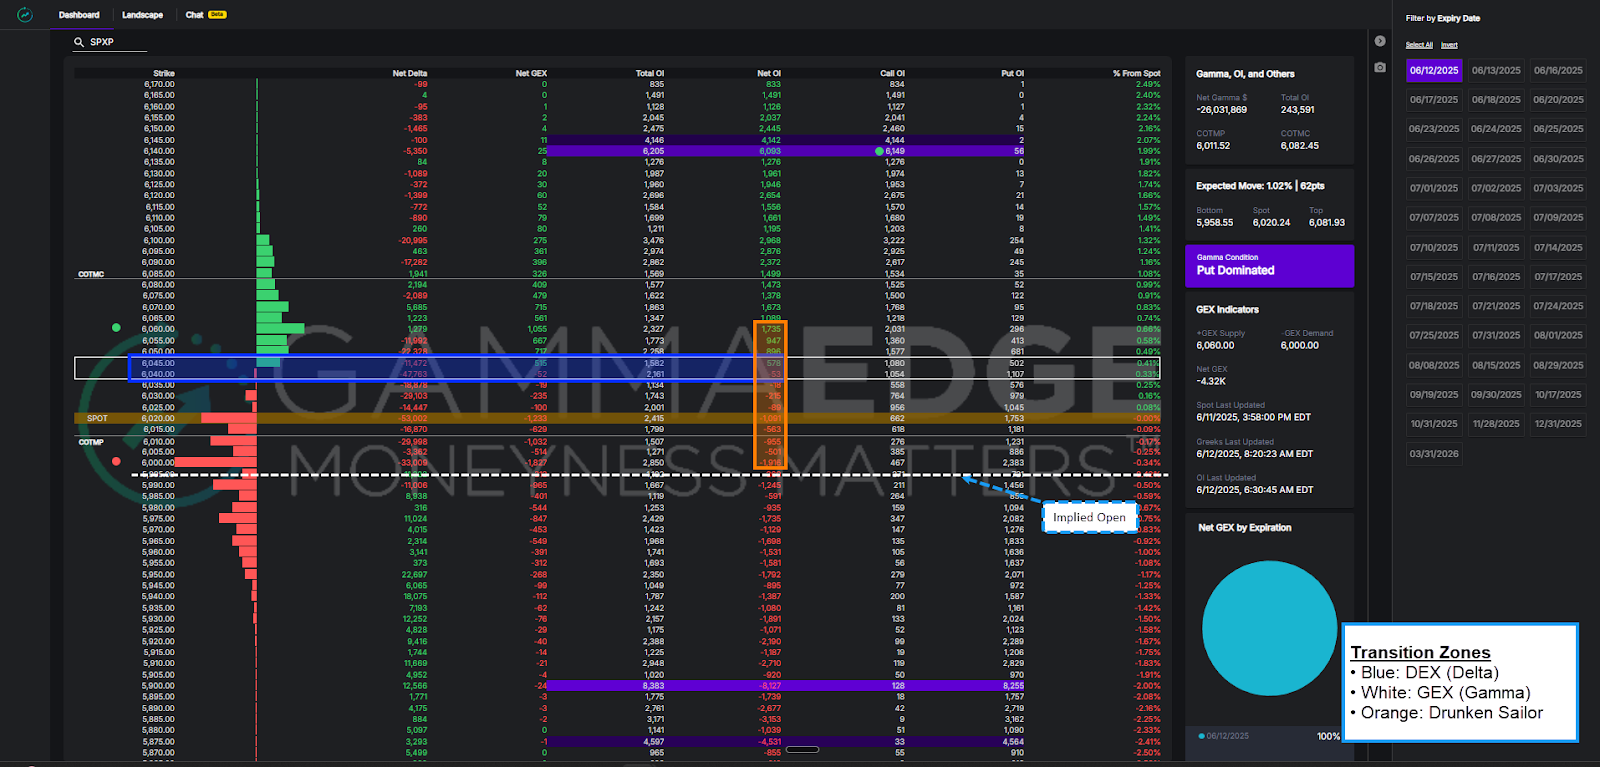
Real Example
The example below from our Web App Dashboard shows that between 517 (Ntrans) and 520 (PTrans), the gamma bars are quite small and shift back and forth from green to red. This is a good visualization of showing the “choppiness” within the Transition Zone as neither puts nor calls are fully in control.
But once you move above PTrans or below NTrans, the gamma bars become much more prominent, showing clear directional control.
Pro-Tip: In the example discussed, this is a call-dominated environment (refer to the “Net Delta” column). Because of this, we would not blindly start shorting the market just because NTrans is lost. We would need to see confluence from the other factors of the model (negative market sentiment, downside market direction via the Market Trend Model, and a downside intraday volume pattern).
When we are in a bullish environment, like in the visual below, and we drop below NTrans, this should first signal that “hey, bulls may not be as strong here as we thought.” From there, we want to see if (i) bulls can quickly reclaim PTrans or (ii) structure starts to deteriorate (i.e., call speculators are removed from the complex by put speculators [the Net Delta column going from green to red above and below spot price]).
Now that you understand how gamma drives acceleration, let's look at the second zone, which reveals something even more fundamental—who's actually in control of the market.
Zone #2: DEX Transition Zone (Your Sentiment Compass)
If GEX shows you the strike where prices are likely to accelerate, DEX shows you which direction the market wants to go. This is your sentiment compass - the zone that reveals who's in control based on actual positioning, not just short-term speculation.
What It Does
The DEX transition zone cuts through market noise to show actual directional bias. Unlike GEX, which can shift dramatically as price moves (because gamma is most sensitive near the money), DEX provides a stable view of market structure.
It's built the same way as GEX—with PTrans and NTrans boundaries—but your Web App uses the "Net OI" column instead of gamma exposure.
How It Works
DEX focuses on the moneyness of options, essentially asking, "Are there more calls or puts at each strike?" This tells you what market participants expect to happen, not just where they're speculating for quick moves.
Green in Net OI = Calls dominate that strike | Red in Net OI = Puts dominate that strike
When you break above DEX PTrans, all strikes above that point are call-dominated. Break below DEX NTrans, and puts take control below that level.
Your Trading Edge
DEX is less sensitive to current price movement than GEX, making it your primary decision-maker for trade direction and risk management. It shows you the underlying structural bias that persists despite short-term price fluctuations.
The area between DEX transition zones often exhibits choppy price action due to the back-and-forth between call and put dominance. This causes market maker exposure to shift within a tight range, creating the sideways grind that frustrates trend-following strategies.
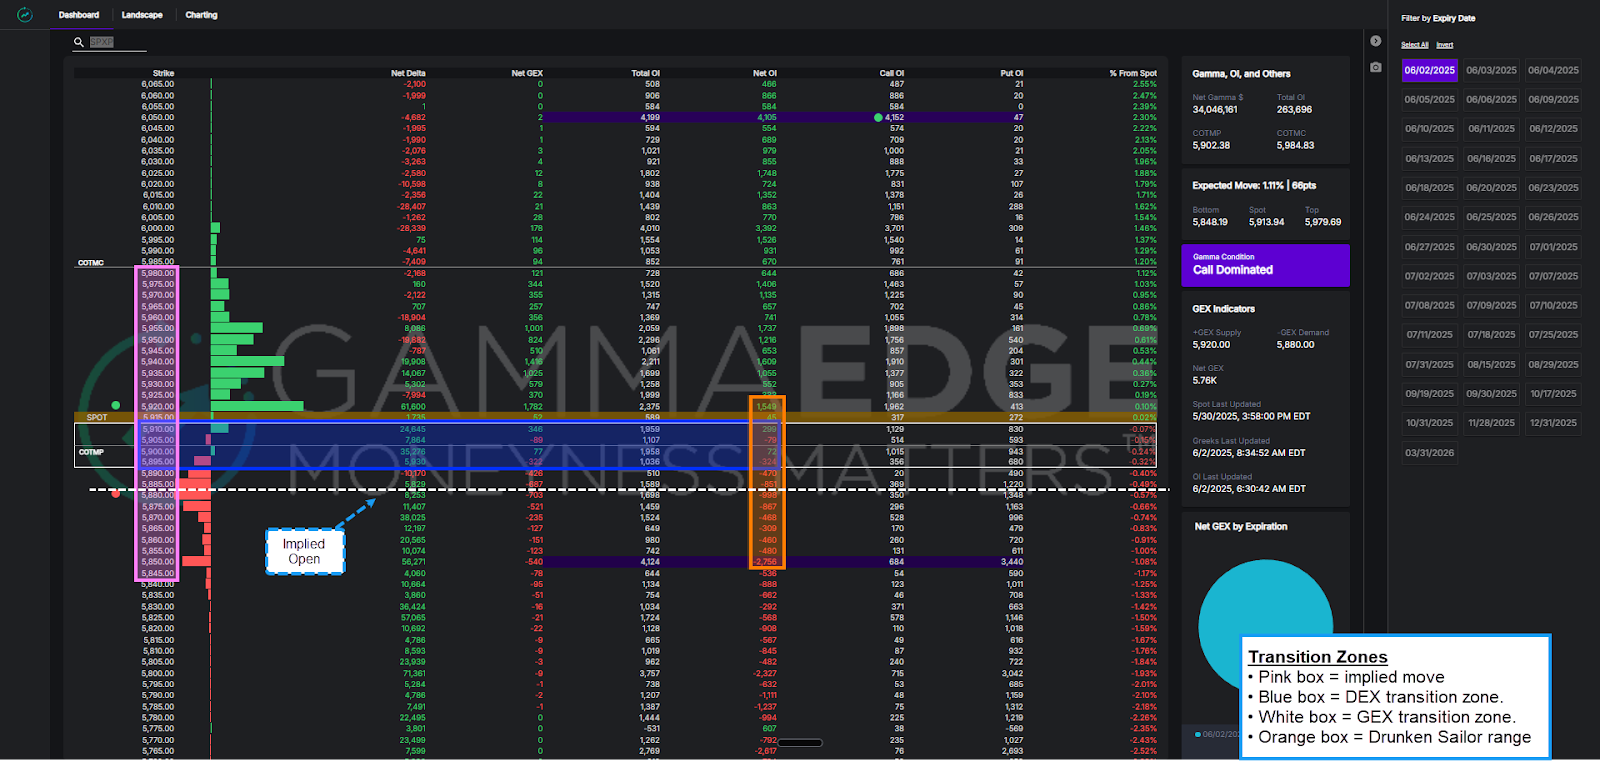
Visual Cues
Look at the Net OI column colors in your Web App. Scan from the current price upward—where does it shift from mixed colors to predominantly green? That's your DEX PTrans (5625 in the example below). Do the same scanning downward for predominantly red—that's your DEX NTrans (5620 in the example below).
By viewing the structure through the lens of DEX, we can identify 'areas of change' in the structure. When we cross the top of the DEX transition zone, for example, we know there's an imbalance where calls dominate for that strike and higher (vice versa for puts to the downside).
Key Insight
When GEX and DEX zones align tightly, you have a high-confidence structure. When they're far apart, expect uncertainty and wider ranges - perfect conditions to reduce position size or wait for better setups.
Within the video below, we provide a further deep dive into reading the DEX transition zone and how to integrate it within your analysis.

Video Key Takeaways
After watching the embedded lesson video, remember these main points:
- The DEX transition zone provides a more stable view of market structure than GEX, as it is determined by market speculators, not spot price movements.
- The 'Net OI' column in the web app is crucial for identifying call or put dominance on each strike.
- The area between DEX transition zones often exhibits choppy price action due to the back-and-forth between call and put dominance.
- Confluence between GEX and DEX transition zones can indicate a well-defined market structure, which reduces noise (chop) and gives clearer market behavior.
- Wide disparities between GEX and DEX transition zones may signal market uncertainty or a transitioning market structure.
GEX tells you when to expect acceleration. DEX shows you the directional bias. But what happens after you break out of these zones? That's where our third zone comes in - specifically designed for the unique challenges of 0DTE trading.
Zone #3: Drunken Sailor Range (Your 0DTE Precision Tool)
The name says it all. Like a drunken sailor wandering unpredictably down the dock, price can stagger back and forth within certain boundaries after breaking out of the GEX and DEX zones. This erratic movement frustrates traders who expect clean, directional moves, but it's not random.
What Makes It Special
The Drunken Sailor Range is unique to SPX 0DTE trading and focuses on where price tends to meander. While GEX and DEX show you the initial breakout zones, Drunken Sailor reveals where that breakout might lose steam or find renewed energy.
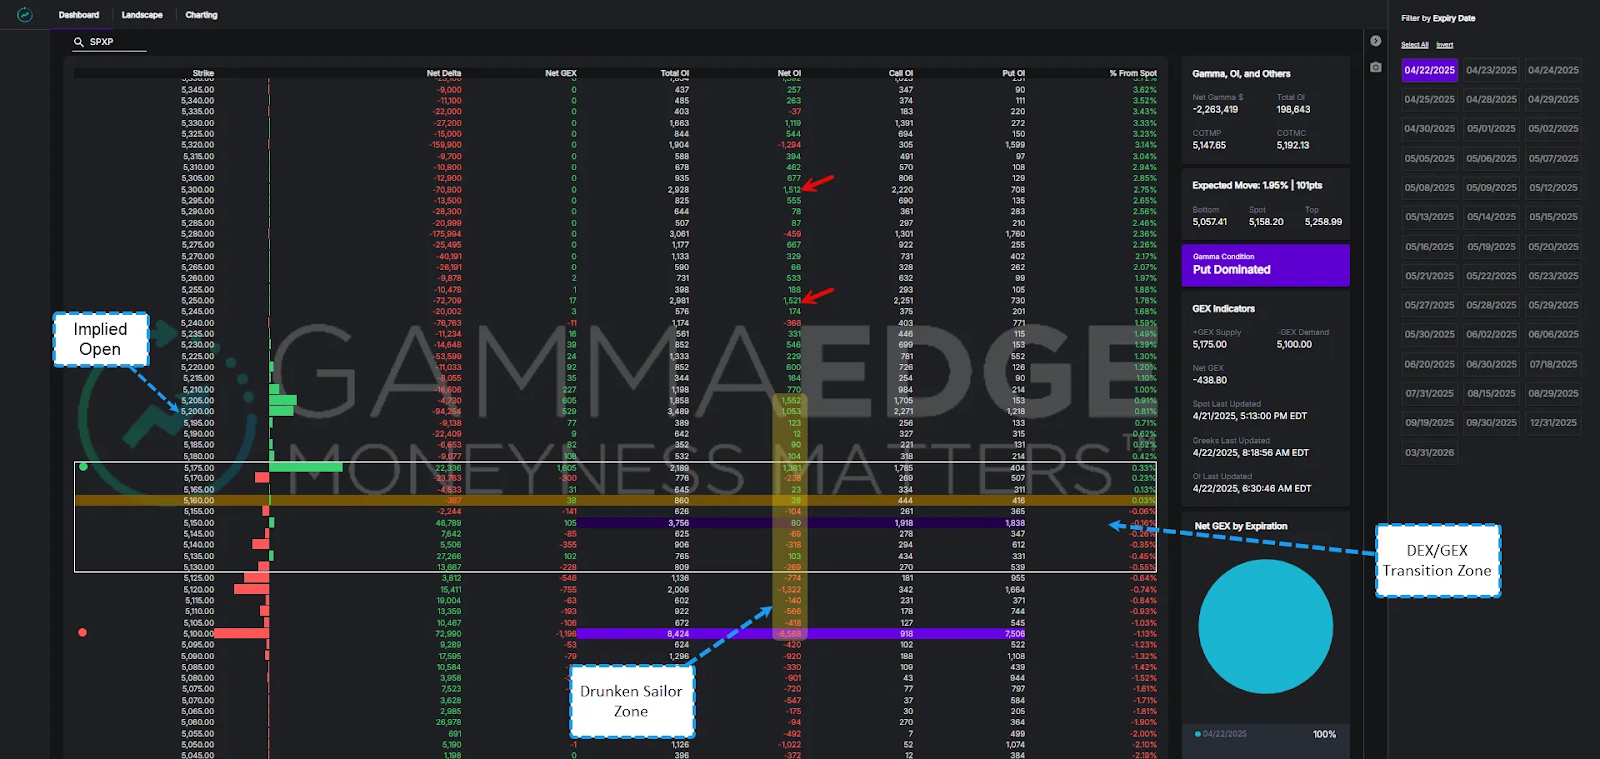
How It's Different
Unlike GEX and DEX, which focus on dominance (calls vs puts), Drunken Sailor analyzes the Net Open Interest distribution gradient, or lack thereof, throughout the 0DTE SPX structure.
Gradient means we’re looking at the increasing and decreasing size of speculative positioning based on how calls and puts are distributed across strikes. This deeper analysis helps identify where price may encounter resistance or support with greater precision than simply knowing "calls are in control here."
The Three Key Factors
- Net OI Distribution: How calls and puts are spread across different strikes
- Charm Decay: Time decay's accelerating impact as we approach expiration
- Volume Requirements: How much trading activity is needed to push through each level
When To Use It
The Drunken Sailor Range becomes most valuable after price has broken out of the GEX/DEX zones. It helps you:
- Identify likely areas where breakouts might stall
- Set more precise profit-taking levels
- Adjust position sizing based on expected choppiness
- Know when to avoid trading altogether (wide, undefined ranges)
Your 0DTE Edge
In the compressed timeframe of 0DTE, understanding where price might meander can be the difference between holding winners and watching profits evaporate. The Drunken Sailor Range sets realistic expectations for how far moves might extend and where they will likely encounter obstacles.
Visual Recognition
Look for areas where Net OI shows gradual changes rather than sharp transitions. These gradual shifts often create the "wandering" price action that characterizes these ranges.
In the video below, we take a deep dive into:
- How the Drunken Sailor Range works
- How to identify it, and most importantly
- How to incorporate it into your trading strategy
Pay special attention to how this range complements your understanding of the GEX and DEX transition zones you discovered earlier.

And if that wasn’t enough, here is a second video we recorded on how to derive the Drunken Sailor Zone:

The Power Combination: When All Zones Align
Understanding each zone individually is valuable, but the real edge comes from reading them together. When you know how to combine all three zones, you can distinguish between high-confidence setups and potential traps.
High-Confidence Signals: Tight Alignment
Your strongest setups occur when GEX and DEX zones overlap and are relatively tight. This alignment tells you that short-term speculation (GEX) and underlying sentiment (DEX) point in the same direction.
What tight alignment means:
- Market makers have clear, defined risk parameters
- Breakouts are more likely to follow through
- Price movements tend to be cleaner and more directional
- Your risk/reward ratios improve significantly
Warning Signals: Wide Divergence
When GEX and DEX zones are far apart, you're looking at conflicting forces in the market. GEX might show tight acceleration zones while DEX reveals mixed sentiment - or vice versa.
What wide divergence means:
- Market uncertainty or transitional conditions
- Higher likelihood of false breakouts
- Choppier price action even after zone breaks
- Time to reduce position size or wait for better setups
Integrating the Drunken Sailor Range
Once you've identified your GEX and DEX alignment (or lack thereof), the Drunken Sailor Range becomes your precision tool for 0DTE execution:
- After a clean zone breakout: Use Drunken Sailor levels for profit-taking decisions (or points in the structure where price starts its next leg higher)
- In choppy conditions: Drunken Sailor ranges help you avoid the worst of the meandering action
- For position sizing: Wider Drunken Sailor ranges suggest smaller positions due to increased uncertainty
Your Quick Assessment Process
Before entering any 0DTE trade, run this simple check:
- Are GEX and DEX zones aligned? (High confidence vs. wait-and-see)
- How tight are the zones? (Explosive potential vs. grinding action)
- What does the Drunken Sailor range suggest? (Realistic profit targets and exit planning)
This three-zone framework keeps you focused on structural forces while filtering out the noise that derails most 0DTE traders.
FAQ: Your Most Critical Questions
Q: Which zone should I prioritize when they conflict?
When GEX and DEX zones diverge, prioritize DEX for directional bias and GEX for timing. DEX is your compass—it shows the underlying structural sentiment that's less likely to shift rapidly. Use DEX to determine whether you should be looking for long or short opportunities, then use GEX to time your entries around acceleration points.
Consider reducing position size or waiting for better alignment if the zones are widely divergent. Conflicting zones often lead to choppy, unpredictable price action that's difficult to trade profitably.
Q: Do these zones work for swing trading and other time frames too?
Absolutely. The GEX and DEX methodology is fractal - it works across all timeframes. You can apply the same principles to weekly options for swing trades or monthly options for longer-term positioning. The key is understanding that longer timeframes give you more time for the structural forces to play out.
However, the Drunken Sailor Range is specific to SPX 0DTE trading due to the unique time decay characteristics and volume patterns of same-day expiration options. For longer timeframes, focus on the GEX/DEX combination.
Our successful PTrans2PGEX Strategy specifically uses the GEX PTrans level for entries.
Q: How do I find these transition zones on my platform?
The GEX transition zone is automatically plotted in your Web App Dashboard. Look for the PTrans and NTrans levels clearly marked with the zone highlighted between them.
The GammaEdge team manually draws DEX transition zones and Drunken Sailor ranges every morning as part of our pre-market analysis. These levels are posted in our daily analysis and Discord channels.
We're working on automating DEX and Drunken Sailor plotting in the Web App, but our morning analysis provides these critical levels for your daily trading plan.
Q: What happens when price gets significantly extended from the transition zones?
Think of this like a stretched rubber band - the further price moves from the transition zones, the higher the probability of a reflexive move back toward the middle. This is especially true in 0DTE where time decay accelerates these mean-reversion tendencies.
When you see prices significantly extended from all three zones, consider taking profits on directional trades and looking for counter-trend opportunities back toward the zone centers. The market tends to "snap back" when stretched too far from these structural anchors.
Q: How do these zones work with other GammaEdge tools?
The transition zones are most powerful when combined with our Market Trend Model and Intraday Volume Analysis (specifically for the intraday timeframe). Here's why this confluence matters:
- For upside breakouts above PTrans, you want to see positive momentum in the Market Trend Model and constructive intraday volume patterns. Without this confluence, even clean zone breaks can fail.
- For downside breaks below NTrans, look for negative trend signals and distribution-style volume patterns to confirm the move has structural support.
- During choppy action within the zones, sideways readings in the Market Trend Model and mixed volume signals often confirm you're in a ranging environment - perfect time to step aside or trade smaller.
The zones show you where things might happen, but the Market Trend Model and volume analysis confirm when and how they will likely unfold.
Pro-Tip: This is especially critical when trading the Drunken Sailor Range. Remember, these zones represent significant speculative buildups in the structure. You need to see substantial volume accelerating through those Drunken Sailor levels to expect continued movement higher or lower. Without that volume confirmation, price often stalls or reverses at these levels, exactly the "wandering" behavior the zone is designed to identify.
Your Foundation is Set
That's it - you now have the complete framework that drives our daily SPX 0DTE (and/or swing trading) analysis. These three zones aren't something you need to master over weeks; they're tools you can start using in tomorrow's session.
The Simple Truth
Every morning, we use exactly this process to break down the 0DTE structure. You've probably seen our YouTube videos, where we dissect the zones pre-market and review how they played out post-market. Now, you understand what we're looking at and why these levels matter so much to our trading decisions.
The beauty of this approach is its simplicity. While other traders are drowning in dozens of indicators, you're focused on the structural forces moving the market. You're reading the playbook that options market speculators are writing.
This isn't about predicting the future - it's about understanding the mechanical forces that drive short-term price action in an options-dominated market. Knowing where the prominent positioning sits and how market makers must respond, you can position yourself with the flow instead of fighting against it.
The framework is complete. The levels will be marked for you each morning. All that's left is putting it into practice.
Until next time,
Taylor
GammaEdge Co-Founder