🌅 Good Morning Reader!
Have you ever wondered when the market is about to make its next big move?
Yes, it’s great that we have charts, indicators, and technical patterns – but those tools tend to be "surface level".
What if I told you there's a way to see the market's underlying balance - or imbalance - that most people completely miss?
Today we're diving into two powerful sentiment indicators that can help you understand when the market is primed for a major shift (or when a trend is likely to persist): True Gamma Zero (TGZ) and True Delta Zero (TDZ).
Why Most Traders Miss the Big Picture
Here's what most traders miss: whether you're trading stocks, futures, or options, today's market can be driven by options market and the associated positioning within.
With the explosion of options trading across all participant types, dealers are managing massive exposure can directly impact price movement - and if you're only looking at legacy indicators, you're missing a key driver of market trends (or lack there of).
Think about it - dealers are constantly hedging risk across:
- Multiple expiration dates
- Hundreds of strike prices
- Both calls and puts
...and not to mention the constant shifting participant positioning.
While you're focus may be on price charts and momentum indicators, there's an entire layer of structural forces operating beneath the surface. That's where true zeros come in.
What Are True Delta Zero and True Gamma Zero?
Think of these as the market's structural balance points:
True Delta Zero (TDZ) is the theoretical balance point where put delta and call delta are perfectly balanced across the entire options complex. It's not driven by current price action (i.e., price invariant) - instead, it shows you where dealer delta exposure transitions from net positive to net negative (and vice versa).
True Gamma Zero (TGZ) represents the theoretical balance point where put gamma and call gamma are exactly balanced. Like TDZ, it's price-independent and helps you see transitions in dealer gamma exposure across the whole structure.
Here's the key insight: when these levels start shifting from downtrends to uptrends, it suggests calls are increasing their influence within the options complex - exactly what you want to see for bullish momentum.
Why This Matters for Your Trading
Instead of getting lost in the complexity of individual options positions by strike, true zeros give you a zoomed out view of structural positioning (in the aggregate).
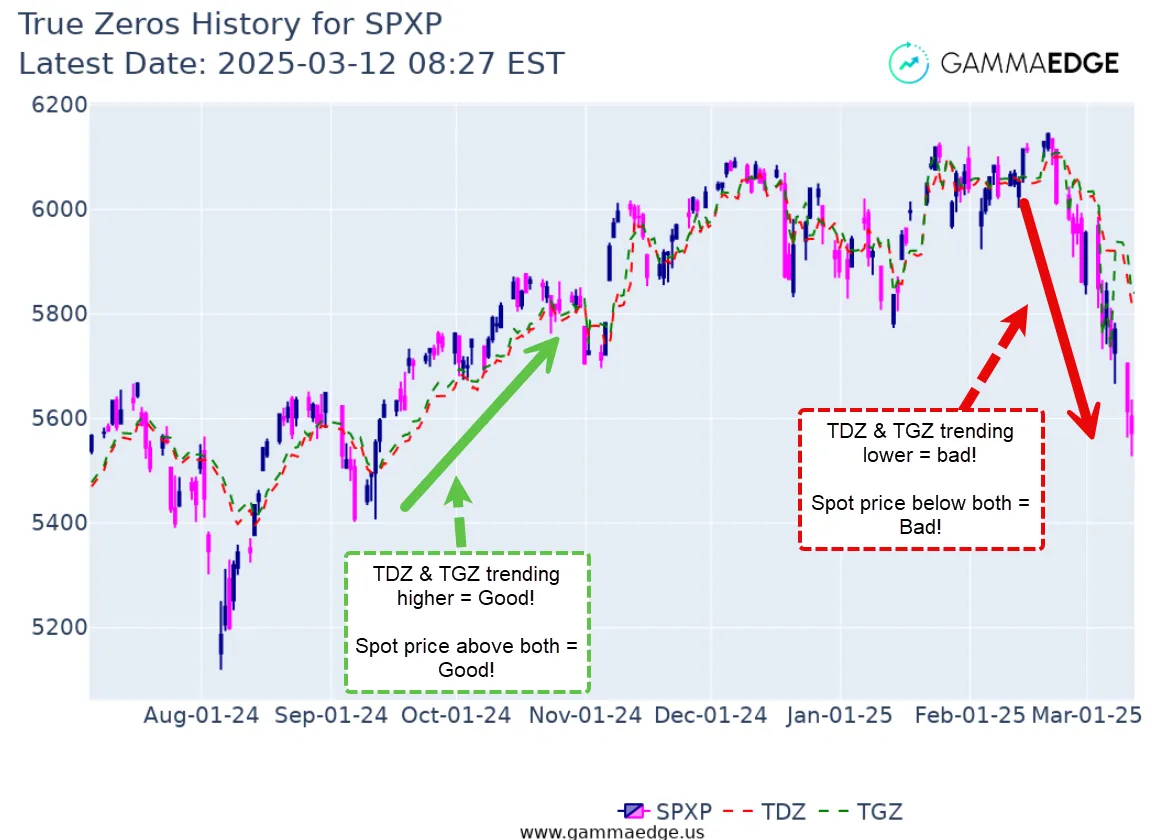
- When TDZ and TGZ are both trending higher, you're seeing evidence that the overall options complex is becoming more call-dominated.
- When they're trending lower, put influence is growing.
Pro Tip: When they (TDZ & TGZ) diverge from price action, you're getting an early warning that structural positioning might not support the current move.
The Real Magic: Watching the Slopes
Here's where it gets interesting. It's not just about where these levels are - it's about how they're moving.
When you see both TGZ and TDZ slopes trending higher together, you're typically in an expansive, bullish environment. When they start flattening out or both trending lower? That's your signal that momentum "under the hood" of the market may be shifting.
The beauty is in the correlation (or lack thereof) between price movement and these structural shifts. Sometimes you'll see divergences - price moving one way while the true zero slopes move another. These divergences often resolve themselves and can provide early warning signals.
A Market Reset Signal
One of the most powerful applications? Identifying when price interacts with these structural levels.
When price approaches or crosses through the true zero levels, you're seeing the market interact with points of minimal dealer exposure. How price behaves around these levels - and how the slopes of the true zeros respond - can give you insight into whether structural positioning is supporting or challenging the current price action.
It's particularly interesting when price moves significantly above or below these levels while the slopes diverge from that price action. These divergences often resolve themselves in meaningful ways.
The Big Picture View
What we love about true zeros is that they give you that 30,000-foot view of market structure. Instead of getting lost in the weeds of individual strikes or expiration dates, you can see the forest from the trees, particularly through the trend of the levels as we just discussed above.
Ready to See This in Action?
The concepts are powerful, but seeing them applied in real-time makes all the difference. We've recorded a detailed walkthrough (below) showing you exactly how to interpret these signals and what to look for when the market approaches these critical balance points.
In the video, you'll see:
- Live examples of TGZ and TDZ in action
- How to read the historical charts to spot trend changes
- The relationship between true zeros and price movement
- Why the slope of these lines matters more than their absolute levels
- How to combine true zeros with other tools in your analysis
Key Takeaways
Before you dive into the video, remember these core points:
- True zeros show structural positioning: where dealers have minimal exposure across the entire complex
- They're price-invariant: these levels aren't driven by current price, but by the options structure itself
- The slope matters more than the level: watch how they're trending over time
- Divergences are powerful: when price and true zero slopes move in opposite directions, pay attention
- They complement other tools: use them alongside your existing analysis framework
- They're not predictive: they show you current structure and help identify potential turning points

True zeros won't tell you exactly where the market is going, but they'll show you where the structural foundation is strongest or weakest, and when conditions may be ripe for significant moves.
Ready to add this powerful perspective to your trading toolkit?
Enjoy the video and see ya next time,
Taylor
GammaEdge Co-Founder