Before progressing further into the GammaEdge methodology and tools, we need to understand a critical component of modern markets: the Market Makers and Dealers who operate behind the scenes.
Think of them as the plumbing in your house - essential to how everything functions, but invisible in daily life. Without them, markets would be inefficient, illiquid, and prone to massive price gaps.
Yet paradoxically, their very actions in managing risk can amplify market movements, creating opportunities for traders who understand the results of their behavior.
In this lesson, we'll demystify Market Makers—the aim is not to turn you into a market structure expert, but rather to show you how understanding their role enhances your ability to use the GammaEdge Framework effectively.
Because while Market Makers don't drive markets, their hedging behavior creates predictable patterns we can capitalize on.
Market Makers: The Unseen Engine of Modern Options Markets
Why Market Makers Matter
Have you ever wondered why you can buy or sell almost any option contract instantly, even if there's no other retail trader on the opposite side of your trade?
Or why certain price levels seem to act like magnets, drawing the market toward them before sharply accelerating away?
The answer lies with Market Makers (MMs) and Dealers (Ds) – the behind-the-scenes players whose actions shape modern markets in profound ways.
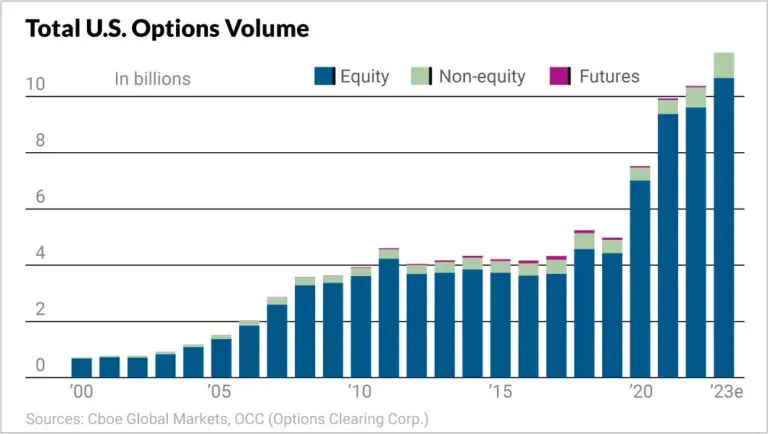
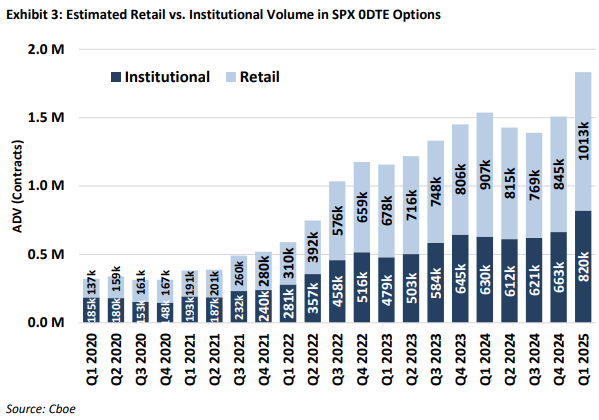
The U.S. options market has experienced explosive growth, with trading volumes reaching record highs year after year. In 2024 alone, total volume across CBOE’s 4 major options exchanges hit 3.8 billion contracts, marking the fifth consecutive record-breaking year. This surge isn't limited to institutional players either – retail participation has more than doubled since 2019, adding another layer of complexity to market dynamics.
Market Makers operate primarily out of sight within this high-octane environment, yet their activities are fundamental to how markets function. Think of them as the market's essential infrastructure – the plumbing that allows the massive daily flow of transactions to occur smoothly and practically instantaneously.
In this lesson, we'll demystify the world of Market Makers by:
- Defining who they are and their core functions
- Explaining how they earn money and manage risk
- Revealing how their hedging activities directly impact price action
- How the GammaEdge Framework transforms complex MM dynamics into actionable trading signals
- Specific ways MM positioning affects the three pillars: Structure, Sentiment, and Trend
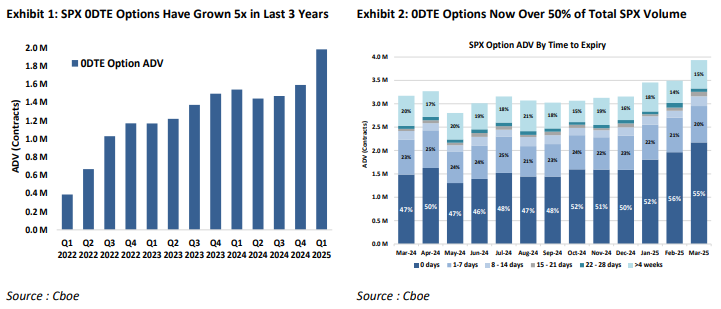
This isn't just theoretical knowledge. As options volume continues to explode and short-dated options (especially 0DTEs) dominate trading activity, the market impact of MM hedging becomes increasingly significant. Understanding these dynamics gives you a powerful lens for interpreting market movement – one that most retail traders lack entirely.
Let's dive in.
Who Are Market Makers and What Do They Do?
Market Makers and Dealers are the entities that actively quote the bid and ask pricing for financial instruments, creating a continuous, two-sided market. They stand ready to transact, ensuring buyers and sellers can execute trades even when a natural counterparty isn't immediately available.
If you've heard names like Citadel, Virtu, Susquehanna, and Wolverine, these are some of the largest market-making firms operating today. They're not small players; their operations are massive and technologically sophisticated, involving billions of dollars in daily transactions.
The Critical Distinction: Market Makers vs. Brokers
It's essential to understand that Market Makers are fundamentally different from brokers:
Market Makers/Dealers:
- Take the other side of trades (provide liquidity)
- Act as principals (trade for their own account)
- Profit from the bid-ask spread and inventory management
Brokers:
- Act as agents (facilitate trades for clients)
- Connect buyers and sellers
- Profit from commissions and fees
- Access existing liquidity
When you log into your broker and trade an options contract, your broker typically isn't taking the other side of your trade directly. Instead, they may first try to match your order with another customer's opposing order within their system. If no internal match is available, they'll route your order to external Market Makers who will take the other side of the trade.
Remember: Market participants' collective buying and selling decisions drive markets. Market Makers react to these decisions through hedging, which can amplify—but not create—market direction. Our GammaEdge Framework helps you see both the underlying speculation and the MM hedging response, giving you a complete picture of market dynamics.
The Mandate: Why Market Makers Exist
Market Makers don't operate out of the goodness of their hearts. Their role is legally mandated by regulators like FINRA and exchanges such as NYSE and Nasdaq. This obligation ensures that markets remain liquid and orderly, even during volatile periods.
Liquidity is the lifeblood of financial markets – it ensures that assets can be bought or sold quickly, at scale, and without significantly moving prices. Without Market Makers standing ready to facilitate trades, markets would:
- Be far less efficient
- Offer wider bid/ask spreads
- Experience more frequent price gaps, and
- Have higher overall transaction costs
As the U.S. options market has grown significantly in size and complexity, the portfolios of MM/Ds have expanded accordingly. This increased scale means their hedging activities can exert substantial influence on price movements, especially in certain market conditions we'll explore later.
How Market Makers Make Money and Manage Risk
Unlike most traders who bet on price direction, Market Makers focus on an entirely different profit model. Their primary source of income is the bid-ask spread – the difference between the price at which they're willing to buy (bid) and the price at which they're willing to sell (ask).
For example, if an MM quotes a stock option with a $2.00 bid and $2.10 ask, they aim to buy contracts at $2.00 (Traders sell at $2.00) and sell them at $2.10 (Traders buy at $2.10), capturing the $0.10 difference. While this amount per contract may seem small, MM/Ds execute vast numbers of trades daily, allowing these small edges to accumulate into significant revenue.
The width of this spread isn't arbitrary – it reflects underlying market conditions, perceived risk, and implicitly, reflects the internal costs that the MM may have in completing the transaction.. In highly liquid markets with intense competition, spreads tend to be very narrow. In less liquid markets or during volatile periods, MM/Ds widen their spreads to compensate for increased risk and slow order flow.
The Inventory Challenge
As MM/Ds facilitate trades, they accumulate a diverse portfolio of options contracts. Over time, this portfolio naturally develops directional biases – becoming either net long or net short various instruments.
This creates a fundamental challenge…
Market Makers are not in the business of profiting from directional moves. Their model depends on capturing the spread while remaining relatively neutral to market direction. When their inventory becomes too skewed, they face significant directional risk that can quickly overwhelm any spread profits.
To address this, MM/Ds must constantly rebalance their inventory through a process called hedging. In the options market, this hedging activity is not merely a risk management technique – it's an essential survival mechanism that has profound effects on the broader market.
Real-World Application: How MM Hedging Works
Let's make this concrete with a simple example:
Imagine you purchase a long call option on SPY. In this scenario, you've taken a position that profits from upward movement in the market - you are long with positive delta. The MM, having sold you this call, assumes the opposite position with negative delta, indicating short exposure.
To balance their books and eliminate market bias (i.e., hedge), they might buy delta (through correlated stocks or futures) to reduce their SPY short exposure, ensuring they remain neutral regardless of market movements.
Imagine this process occurring across the entire U.S. options market – millions of contracts changing hands daily, with Market Makers on the other side of many trades. You can see how, if MM/Ds become significantly long or short as a group, their collective hedging could enormously impact underlying asset prices.
The Greeks: Market Makers' Risk Dashboard
To understand MM hedging, we must grasp the quantitative measures they use to track risk – the "Greeks." These metrics, derived from options pricing models, quantify an option's sensitivity to various factors.
While there are several Greeks, we'll focus on the two most crucial for understanding market impact:
Delta (Δ): The Directional Risk Measure
Delta measures how much an option's price changes when the underlying asset's price moves by $1.00. It essentially quantifies directional exposure:
- Call options have positive deltas (ranging from 0 to 1)
- Put options have negative deltas (ranging from -1 to 0)
- A delta of 0.50 means the option behaves like owning 50 shares of the underlying stock
Market Makers aim to maintain "delta-neutral" portfolios, meaning their overall position is relatively insensitive to minor price changes. When they sell calls to customers (MM becomes "short delta"), they typically buy the underlying asset to offset this exposure. When they sell puts (becoming "long delta"), they sell the underlying.
This constant balancing act allows them to isolate their profitability toward the bid-ask spread rather than market direction.
Gamma (Γ): The Change in Delta
Here's where things get interesting. Delta isn't constant – it changes as the underlying asset price moves. The $1 change in a $101 option price from the stock moving from $100 to $101 is not the same as the change in option price for the $102 option when the underlying moved from $100 to $101. This is Gamma, which measures the rate of delta change due to a change in the underlying price.
Gamma is highest for options at-the-money (ATM, where the strike price is close to the current market price) and increases dramatically as expiration approaches. High Gamma means that an option's delta will change rapidly in response to even small movements in the underlying price.
This presents a significant challenge for delta hedging if an MM is delta-neutral but holds positions with high gamma (particularly if they are "short gamma," which often results from selling options to customers), a significant, fast move in the underlying price can cause their delta exposure to change so quickly that their initial hedge becomes instantly unbalanced, exposing them to risk.
The need to constantly adjust hedges in response to changing delta creates persistent buying or selling pressure in the underlying market – a key mechanism through which options activity influences underlying asset prices.
How MM Hedging Shapes Market Structure and Price Action
The hedging activities of Market Makers aren't just internal risk management procedures – they directly shape price action and market structure. This occurs through a process that begins with customer order flow and transmits through MM hedging.
When traders buy or sell options contracts, MM/Ds must take the other side, accumulating options positions with inherent risks. The net aggregate of this customer activity determines the overall positioning of the market-making community and dictates their hedging needs.
Market-Wide Gamma Exposure (GEX)
One of the most powerful concepts for understanding MM influence is market-wide Gamma Exposure, or GEX. This represents the aggregate gamma position of dealers, indicating how sensitive their collective portfolios are to price changes.
GEX is typically measured as the total dollar amount of the underlying asset MM/Ds would need to buy or sell to re-hedge their delta exposure for every 1% move in the underlying price. The sign of GEX – positive or negative – reveals the prevailing hedging regime:
Positive Gamma Environment (Dealers Long Gamma):
- Arises when MM/Ds are long gamma - typically occurs when traders are net short options (primarily selling calls near market tops or selling puts during market bottoms when downward movement becomes less apparent and a market turn upward is imminent)
- MM/Ds are forced to "buy low, sell high" for hedging purposes
- Dampens volatility and promotes range-bound behavior
- Market tends to stabilize with less directional momentum
- Key insight: Can occur in both call-dominated AND put-dominated structures, but is more easily visible in call-dominated environments near market tops
Negative Gamma Environment (Dealers Short Gamma):
- Occurs when MM/Ds are short gamma - typically when traders are net buyers of options (buying calls during rallies or buying puts during selloffs)
- MM/Ds are forced to "sell low, buy high" for hedging
- Amplifies volatility and reinforces trends both upwards and downwards in prices
- Market tends to be more volatile with stronger directional moves
- Key insight: This is the more common environment during active speculation periods
Important Clarification: The gamma environment (positive or negative) is determined by whether dealers are net long or short gamma - NOT simply by whether the structure is call or put dominated. For example:
- Call-dominated structure with traders shorting calls = Positive gamma environment (dealers long gamma)
- Call-dominated structure with traders buying calls = Negative gamma environment (dealers short gamma)
- Put-dominated structure with traders selling puts = Positive gamma environment (dealers long gamma)
- Put-dominated structure with traders buying puts = Negative gamma environment (dealers short gamma)
Understanding whether the market is in a positive or negative gamma environment provides critical context for interpreting price action and selecting appropriate trading strategies.
The "Tail Wags the Dog" Phenomenon
This significant influence of MM hedging gives rise to what's often called the "tail wagging the dog" – situations where activity in the relatively smaller options market exerts a disproportionate influence on the much larger underlying asset market.
A dramatic example is the "Gamma Squeeze," where a surge in call buying forces MM/Ds into a powerful feedback loop:
- Traders buy large amounts of call options (and dealers are short these calls and are short Gamma)
- MM/Ds must hedge delta by buying the underlying
- This initial buying of underlying stock pushes the stock price higher
- As price rises, traders buy more call options, forcing the dealer to be short again, forcing dealers to be short more gamma, forcing MM/Ds to buy even more shares
- This additional buying pushes the price even higher, requiring even more delta hedging
- The cycle can create explosive upward price movement
The rise of Zero Days to Expiration (0DTE) options has significantly amplified these dynamics. With gamma reaching its peak magnitude as options near expiration, MM/Ds face enormous gamma risk within extremely short timeframes when trading 0DTEs, necessitating rapid, large-scale hedging throughout the trading day.
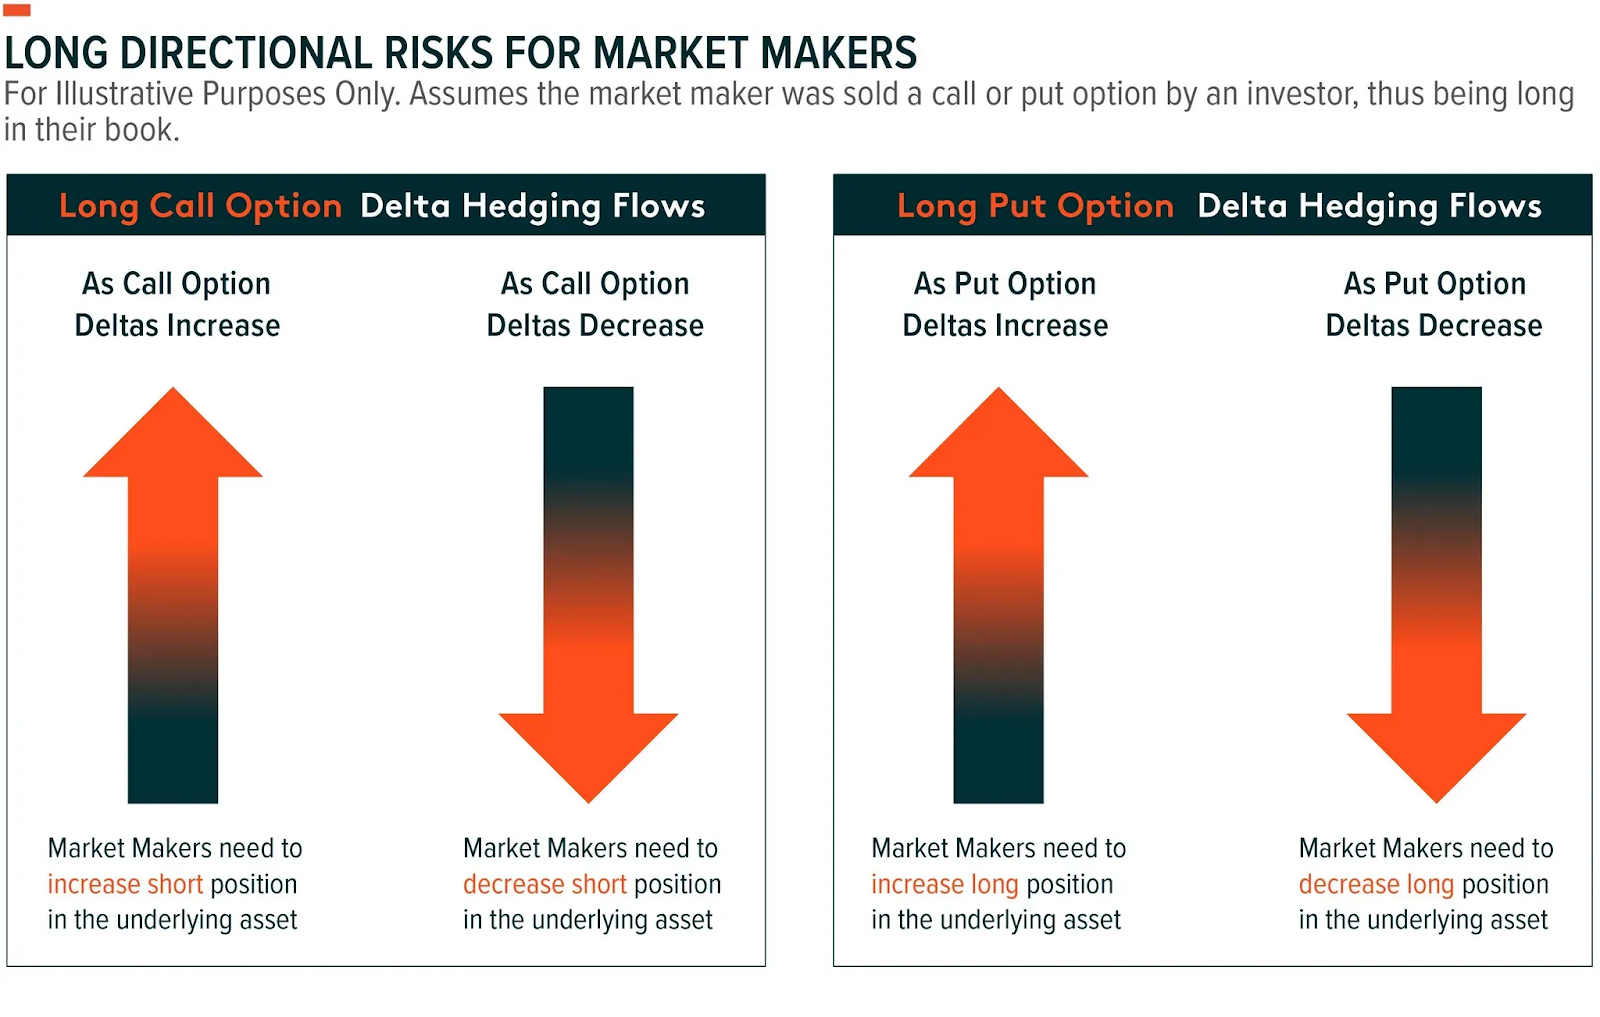
Credit: @doctradermcgraw. If the Market Maker is LONG a call (left graphic), they get longer as the call goes further ITM; therefore, they must short to hedge themselves flat. If they were short this call, they’d have to buy!
Connecting MM Activity to the GammaEdge Framework
The actions of MM/Ds are not arbitrary but are a fundamental aspect of market operations, mandated by exchange regulations to ensure liquidity and stability. By understanding when and where MM/Ds are likely to buy or sell substantial stocks/futures to hedge their positions, traders can unlock a robust understanding of potential market movements.
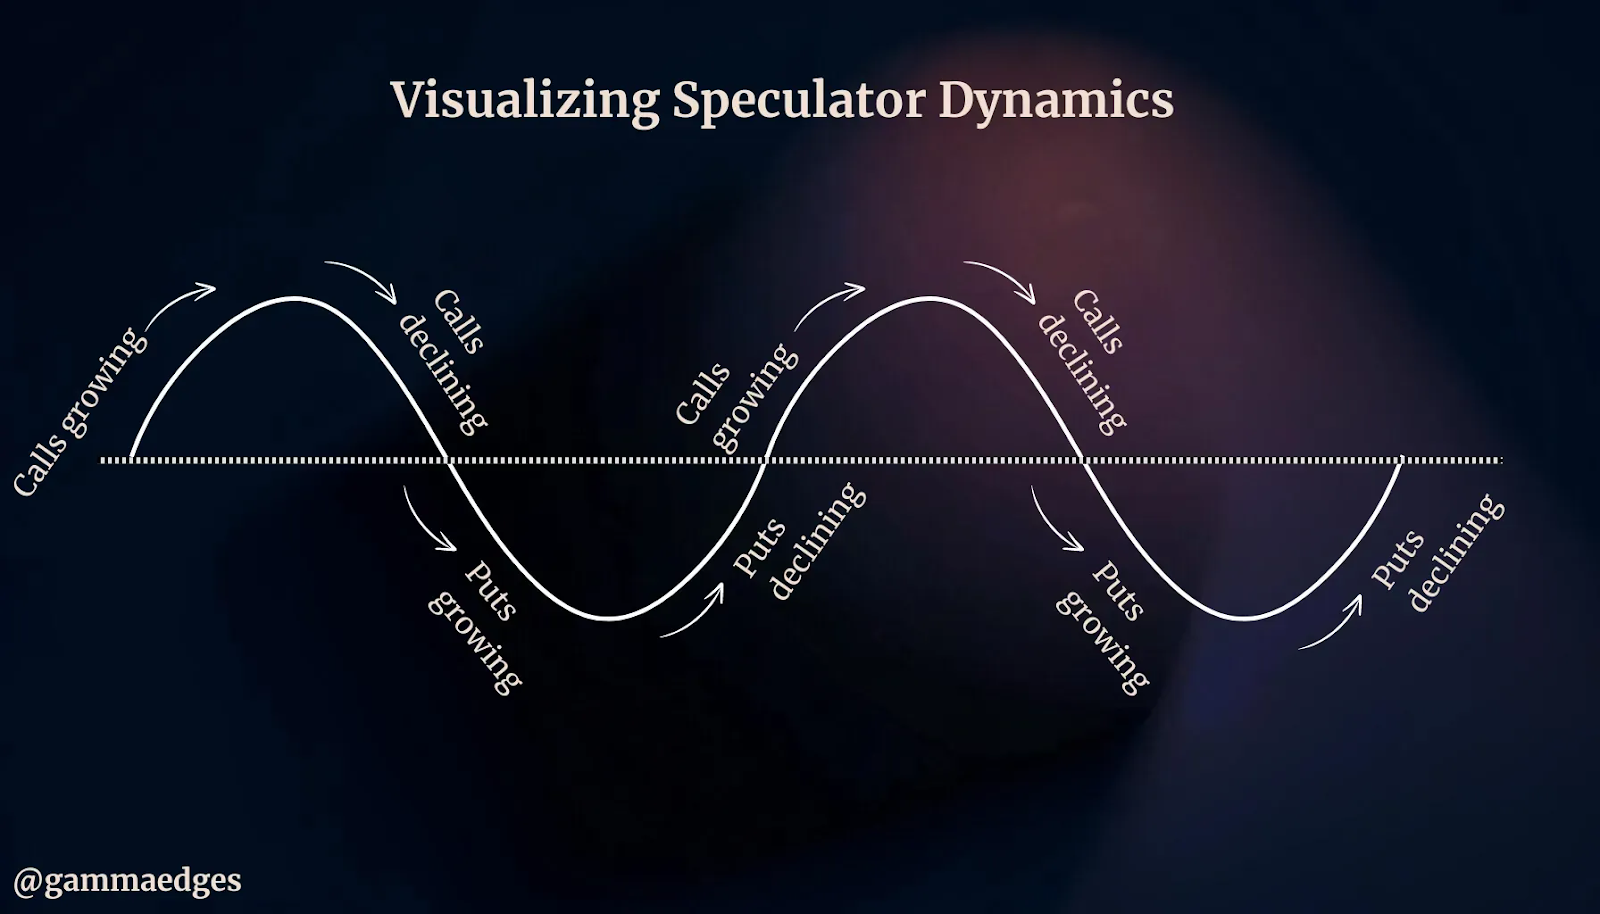
Taking a quick step back, we (GammaEdge) view the market as a dynamic tug-of-war between call and put speculators, akin to a sine wave. This continuous battle between bulls and bears manifests in the options market through speculation, which informs positioning. By analyzing this positioning, we can better understand whether call speculators are gaining the upper hand over spot price or if put speculators exert more force below. This helps us anticipate where Market Makers must hedge and where the price might be pushed next.
Understanding market speculators' behavior, which directly drives Market Maker hedging behavior, is the sole purpose of our three-pillar framework centered around Sentiment, Trend, and Structure.
As noted in the foreword to this lesson, our methodology and tools translate speculators' actions (and the resulting Market Maker responses) into actionable information we can use in our trading. When speculators position themselves, Market Makers react, and our framework helps you anticipate these reactions before they impact price.
1. Sentiment
As noted above, markets move along a path similar to that of a sine wave — markets can either be completely call dominated, put dominated, or shifting somewhere in-between. This constant ebb and flow directly influences Market Maker positioning, as they must continuously adapt their hedging strategies to match the prevailing sentiment.
Understanding the "sentiment" of the market - essentially the balance of power between call and put speculators - enables you to more accurately gauge if the bulls or bears have the upper hand. This understanding is crucial because it helps predict how Market Makers will adjust their hedging, which in turn influences price direction. This knowledge ultimately helps with trader bias, trade selection, and trade execution (entries and exits).
This foundational knowledge is crucial as the purpose of the GammaEdge toolkit — to simplify the complex options markets such that you can easily interpret and act on these market dynamics in real-time.
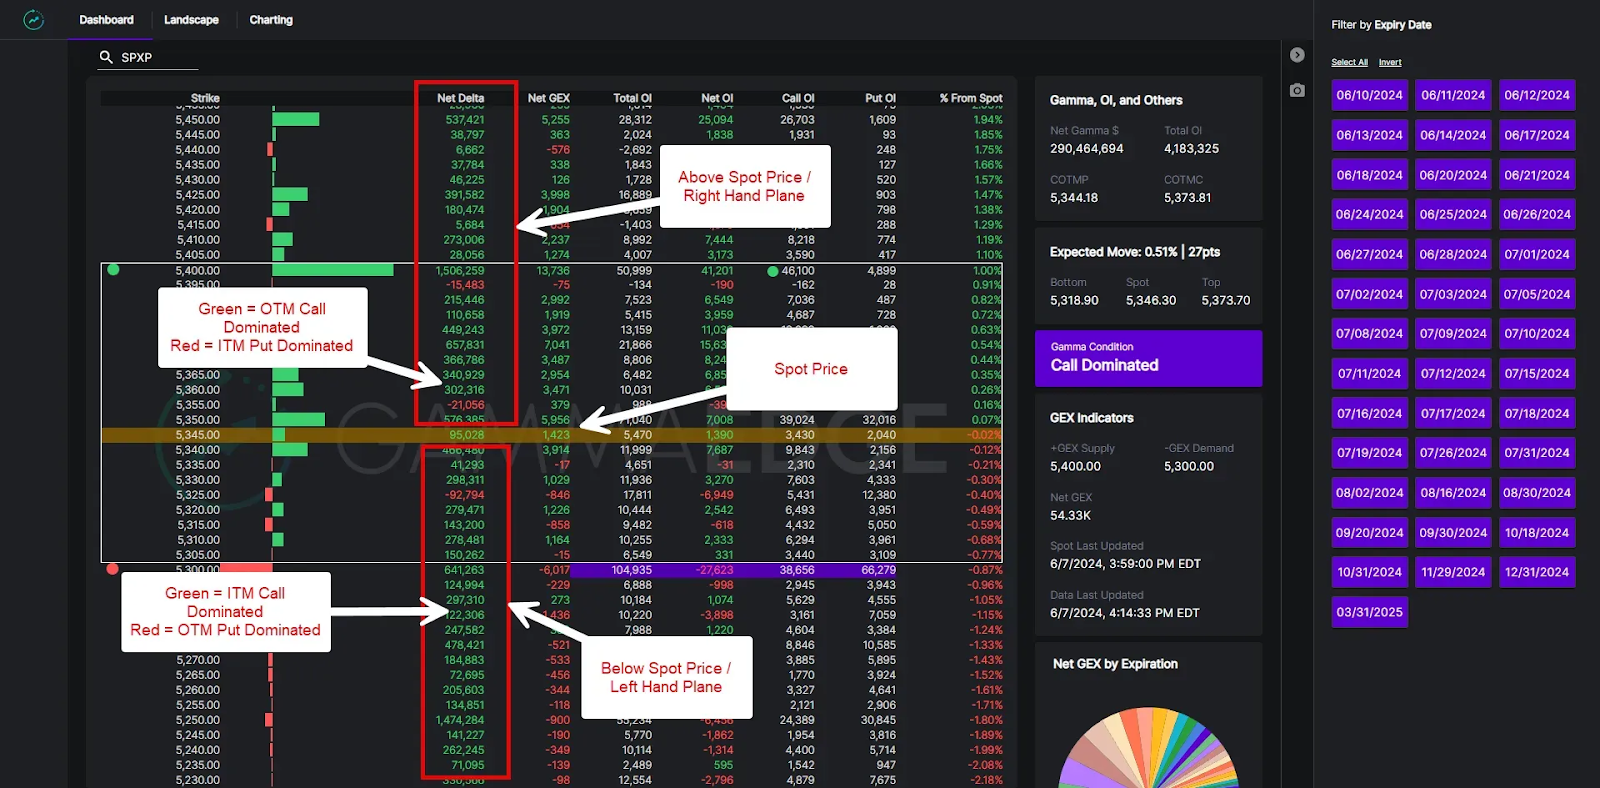
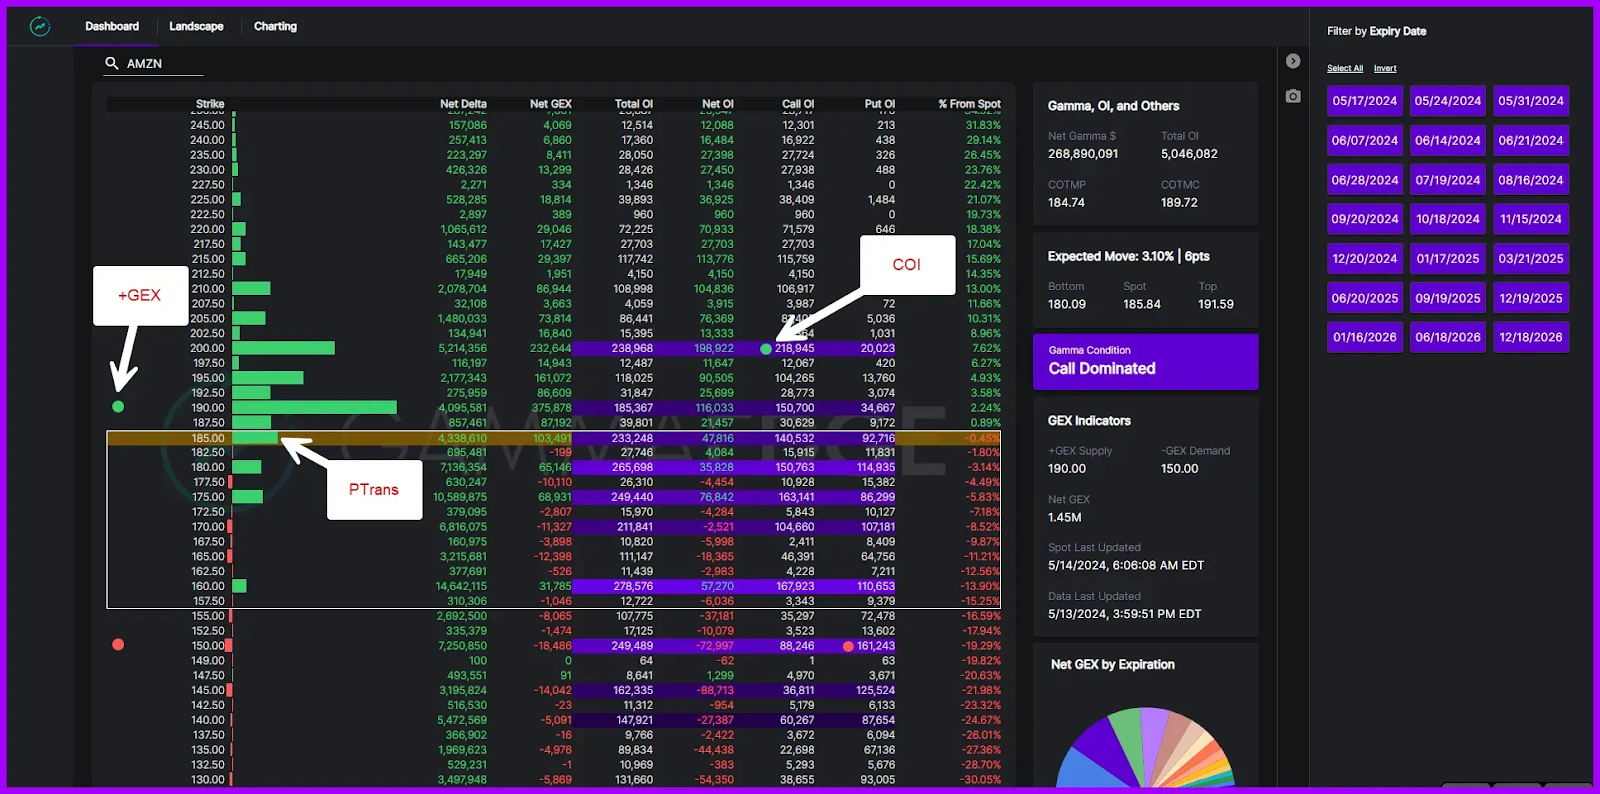
Using our Web App Dashboard, which is a visualization of the underlying options market (SPX in this case), here is an example of a call-dominated environment. In general, a call-dominated environment is the backbone of a bullish market structure. In this scenario, Market Makers are typically short calls (having sold them to bullish speculators) and must buy the underlying to hedge, creating supportive flows that aid price movement higher. This is an environment where MM hedging reinforces the upward trend, giving us reason to consider long positions in alignment with these structural forces.
NOTE: This lesson is a simplistic overview of our process and we understand that markets shift and are not static, which is why we have developed our Market Turning Framework. This framework helps us identify when markets are shifting from bullish (call dominated) to bearish (put dominated) and vice versa. You can review that lesson HERE.
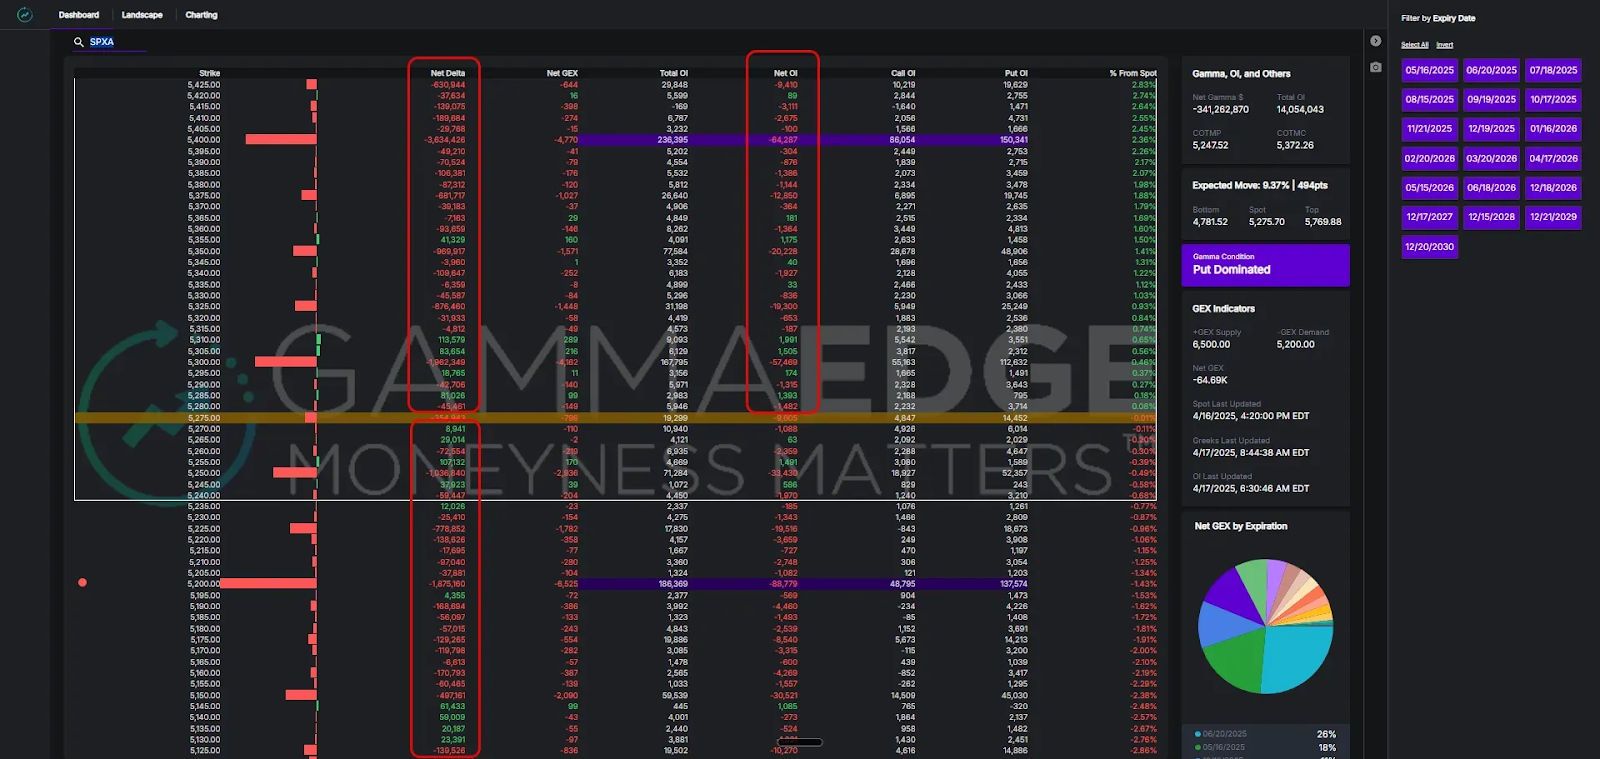
And here is an example of a put-dominated environment, which is the signature of bearish and volatile market conditions. In this structure, Market Makers are typically short puts and must sell the underlying to hedge, accelerating downward moves.
The key takeaway here is if knowing this key information on market structure, would you try to force a trade to the upside or would you be keen to trade more in-line with how the market is currently positioned (i.e., short or sitting in cash)?
Understanding these structural forces and their impact on MM hedging behavior will help shape your market bias and lead to better-informed trades.
Options market activity, which MM/Ds facilitate, offers quantifiable gauges of market sentiment. By analyzing the balance of call versus put activity and understanding how Market Makers must position themselves in response, we can assess not just the market's mood but anticipate the likely hedging flows that will follow.
2. Trend
While our Market Trend Model operates independently of options market activity, it provides critical context for understanding how Market Maker behavior aligns with broader market momentum. The MTM tracks actual buying and selling pressure through the Cumulative Tick, giving us a real-time view of market momentum across multiple timeframes. This helps us anticipate when MM hedging will support or resist prevailing trends.
It's important to understand that Market Maker flows aren't the driving force behind market trends—they're reactive mechanisms that tend to reinforce what's already happening. When traders, institutions, and other participants are constructive about the market moving higher, MM/Ds adapt their positioning accordingly. Their hedging activities can amplify these moves, but don't create them.
This is precisely why our three-pillar framework is so robust. By combining:
- Market structure shaped by MM positioning (tells us where hedging pressure exists)
- Sentiment reflected in options activity (shows us which side MMs are likely hedging)
- Trend captured by the Market Trend Model (reveals if MMs will be trading with or against momentum)
...we get a comprehensive view of what the market "by and large" is doing. When all three align—bullish MTM coinciding with call-dominated structure and positive sentiment—we have higher confidence that MM hedging flows will act as a tailwind rather than a headwind to price movement.
The key takeaway is that MM/Ds participate in a larger ecosystem. Their activities can certainly influence short-term price action through hedging flows, but they ultimately follow and adapt to the collective actions of all market participants. This is why looking for confluence across all three pillars gives us the most complete picture of market dynamics — and the Market Trend Model is one tool we’ve developed that helps us identify when these reinforcing dynamics are likely to occur.
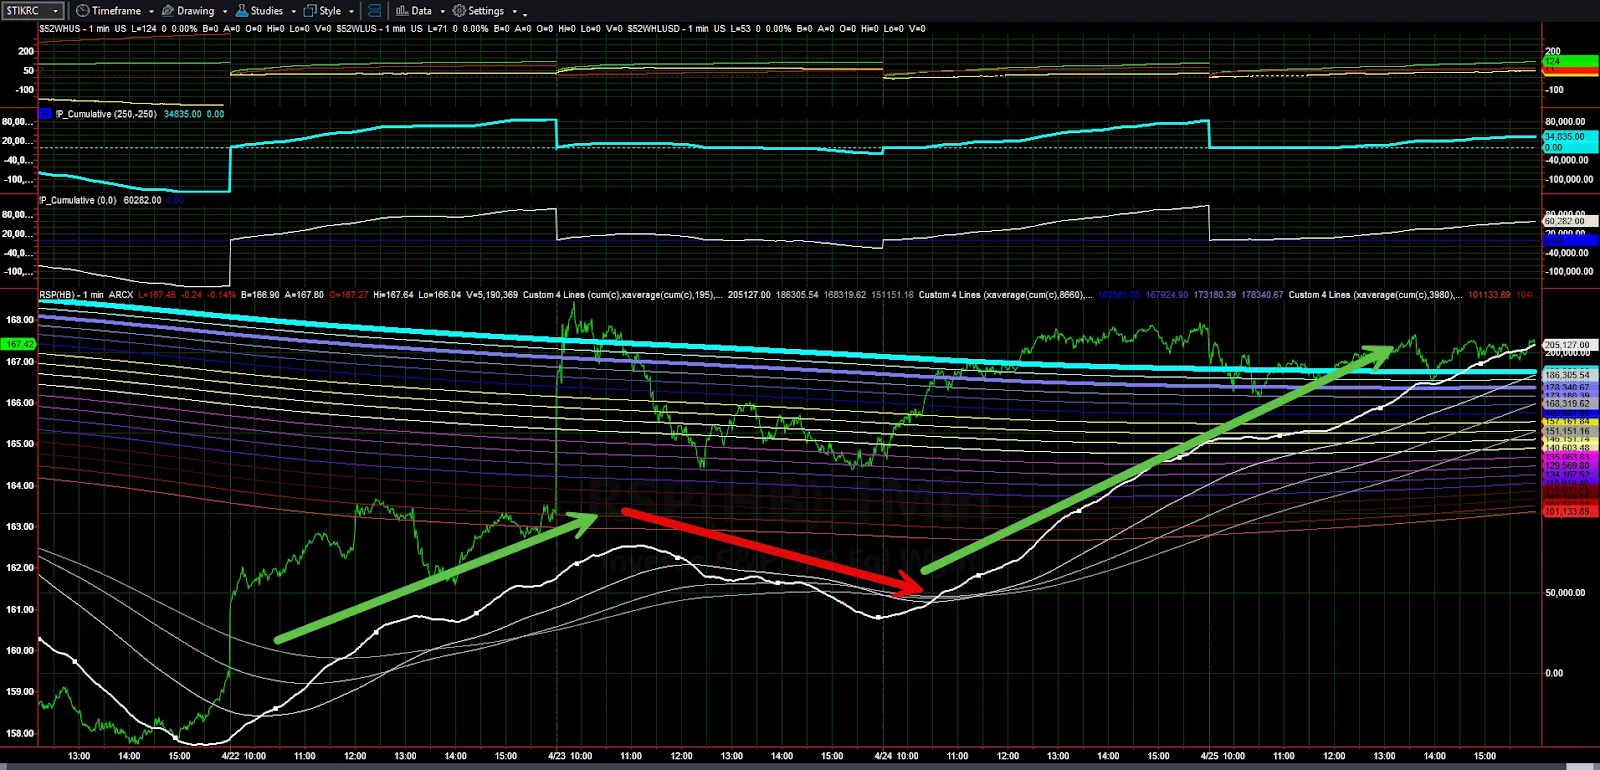
For instance, when the Cumulative Tick and Railroad Tracks are properly stacked and trending in the same direction (like below) as the options structure, MM hedging flows are more likely to act as a tailwind than a headwind to price movement. In this aligned state, Market Makers are forced to hedge in the direction of the trend, creating self-reinforcing price action.
This connection between trend and structure is why we emphasize looking for confluence between the Market Trend Model and options positioning signals—it tells us when the technical trend and structural forces are working together, creating higher-probability trading opportunities.
NOTE: If you are unfamiliar with the Market Trend Model, we have a dedicated deep dive for you HERE.
3. Structure
Market structure refers to the underlying positioning within an options structure, as this positioning directly dictates where and how Market Makers must hedge their exposure. These structural elements have a significant influence on spot price movement because they determine when MM hedging will occur and at what magnitude.
Large concentrations of delta and gamma (i.e., large positioning of options) at specific strike prices represent levels where significant MM hedging is likely to occur. These levels can act as magnets or "pins," potentially containing price movement as MM/Ds hedge around those strikes. For example, if there's a large gamma concentration at the 5000 strike in SPX, Market Makers will need to buy when price dips below 5000 and sell when it rises above, creating a gravitational effect. If these high-gamma levels are breached decisively, the resulting accelerated hedging can lead to sharp breakouts as MMs are forced to chase price.
At GammaEdge, we identify key levels in the options structure where MM hedging flows are most influential. These levels include:
- The DEX & GEX Transition Zone (bounded by PTrans and NTrans): The area where MM/Ds have minimal directional exposure, resulting in choppy, range-bound price action. In this zone, Market Makers are closest to neutral and have less need to hedge, allowing price to drift without structural reinforcement.
- Key Upside/Downside Targets (GEX and COI/POI): Levels where significant hedging activity occurs, often acting as profit-taking zones. These are areas where MM hedging pressure intensifies, potentially creating resistance or support as dealers adjust their positions.
The purpose of this article is not to go into the nitty gritty of all the key structural levels we utilize within the options structure (we have separate deep dive articles for that), but the purpose is to introduce the fact that these key levels do exist, we know how to find them, and have developed tools and a methodology to simply these complex ideas into an actionable trading strategy.
NOTE: Stay turned for a deep dive in the coming weeks for all things (i) key transition zones and (ii) trading levels we use. In the meantime, we discuss this all within our flagship education course, The GammaEdge Framework, which you can access HERE. This is literally our entire trading methodology explained for you.
Why This Matters for Your Trading
Market Makers and Dealers are far more than passive facilitators – they are integral components of the market's operating system, particularly in the dynamic and rapidly growing options space.
Their continuous hedging process directly influences underlying asset prices, shapes market structure through dynamic support and resistance zones, and dictates the prevailing volatility regime. Whether hedging flows act to dampen volatility (positive gamma) or amplify it (negative gamma) is a critical factor in determining market character.
This understanding provides invaluable context for traders using the GammaEdge Framework. The framework's core pillars – Structure, Sentiment, and Trend – are tangibly shaped by MM mechanics:
- DEX/GEX levels derived from MM positioning inform the Structure
- Options order flow facilitated by MM/Ds provides quantifiable measures of Sentiment
- The nature of MM hedging flows, when combined with the Market Trend Model, helps you identify when structural forces will support or resist the prevailing trend
By grasping these underlying forces, you can interpret GammaEdge signals with greater depth and confidence. This knowledge transforms the framework from a set of indicators into a lens for decoding the actions of the market's most influential players.
GammaEdge Tools: Tracking MM/D Behaviors
At GammaEdge, we've developed advanced tools that help you track and interpret Market Maker positioning without requiring a PhD in options theory. Our tools translate complex market dynamics into actionable information & strategies through our three-pillar framework - Structure, Sentiment, and Trend.
Our Web App Dashboard is specially designed to visualize key aspects of market structure shaped by MM activity, including:
- The Transition Zone, where market maker influence is minimal
- Key upside and downside levels where hedging flows intensify
- The balance of call and put dominance throughout the options chain
These tools allow you to anticipate potential market movements based on structural forces, giving you an edge that most retail traders lack.
NOTE: The Web App Dashboard is just one key tool we leverage. All other tools are introduced as part of the New User Onboarding process (and actively discussed throughout the trading day within the Community).
Final Thoughts: The Market Maker Perspective
Market Makers and Dealers are more than just intermediaries; their activities shape the very structure of the options market and price action itself.
By understanding their operations – how they facilitate trades, manage risk through hedging, and influence price dynamics – you gain a powerful lens for market analysis. This perspective allows you to:
- Identify key price levels where structural forces will likely influence movement
- Anticipate potential acceleration points where hedging flows intensify
- Recognize market regimes (positive vs. negative gamma) that favor different trading approaches
- Understand how options positioning creates support and resistance zones
As understanding of The GammaEdge Framework advances, you'll unlock how this foundational knowledge connects with our specific tools and indicators. The market maker perspective isn't just a theoretical concept – it's the essential context for interpreting the signals our tools provide.
And before we go, here is a actions items list for you that can be implemented as soon as the next trading session:
- Watch for confluence between our three pillars - when Structure, Sentiment, and Trend align, MM flows are likely to support your trade
- Pay attention to the Transition Zone - it shows where MM influence is minimal and price can drift
- Use Delta & Gamma levels to identify potential acceleration or deceleration points
- Remember: You don't need to become a market structure expert - our tools translate these dynamics into clear trading signals
Until Next Time,
Taylor
GammaEdge Co-Founder
P.S. Here are a few common misconceptions about Market Makers:
❌ "Market Makers manipulate prices"
✅ Market Makers hedge to manage risk, not manipulate markets
❌ "Market Makers always trade against retail"
✅ MMs provide liquidity and manage inventory, not target retail traders
❌ "Market Maker flows drive markets"
✅ Speculation drives markets; MM flows can amplify existing trends